
The site's hierarchy
Navigation
| M | T | W | T | F | S | S |
|---|---|---|---|---|---|---|
| 23 | 24 | 25 | 26 | 27 | 28 | 1 |
| 2 | 3 | 4 | 5 | 6 | 7 | 8 |
| 9 | 10 | 11 | 12 | 13 | 14 | 15 |
| 16 | 17 | 18 | 19 | 20 | 21 | 22 |
| 23 | 24 | 25 | 26 | 27 | 28 | 29 |
| 30 | 31 | 1 | 2 | 3 | 4 | 5 |
- Les premiers zoom de galaxies sont accessibles
- Le halo FOF 6133 de la boite Horizon L et le halo FOF 544 de Horizon S ont été resimulés avec plusieurs techniques de zoom. Il est important que chaque "zoomer" valide sa méthode, avant de lancer une campagne de zoom sur un plus grand cataloque.
- Les données de la simulation Mare Nostrum sont disponibles
- 34 snapshots jusqu’à z=4 sont accessibles sur horizon3 et sur le serveur de fichiers de l’IDRIS à la collaboration Horizon.
- Méso Machine HPC1 opérationnelle
- Depuis le 23 Octobre 2005, la Méso machine du site horizon est operationnelle. Elle correspond à 3 quadriprocesseurs avec chacun 64 Giga de RAM reliés par infiniband, ainsi qu’un access conséquent (sur une base de projet dédié) au reste de la ferme). Son acces est ouvert a toute personne de la collaboration ayant acces à la minigrille et qui en fait la demande a admin-minigrille
- http://
- Workshop Horizon le 14 et 15 novembre 2005
- Il aura lieu à Paris les 14 et 15 novembre 2005 (prévoir une nuit sur place). L’enregistrement est ouvert dans la rubrique "meeting!"
- http://
Scale Comparison
Scale Comparisons
This section contains quick comparisons between the different boxes.

![]() According to Adaptahop
According to Adaptahop

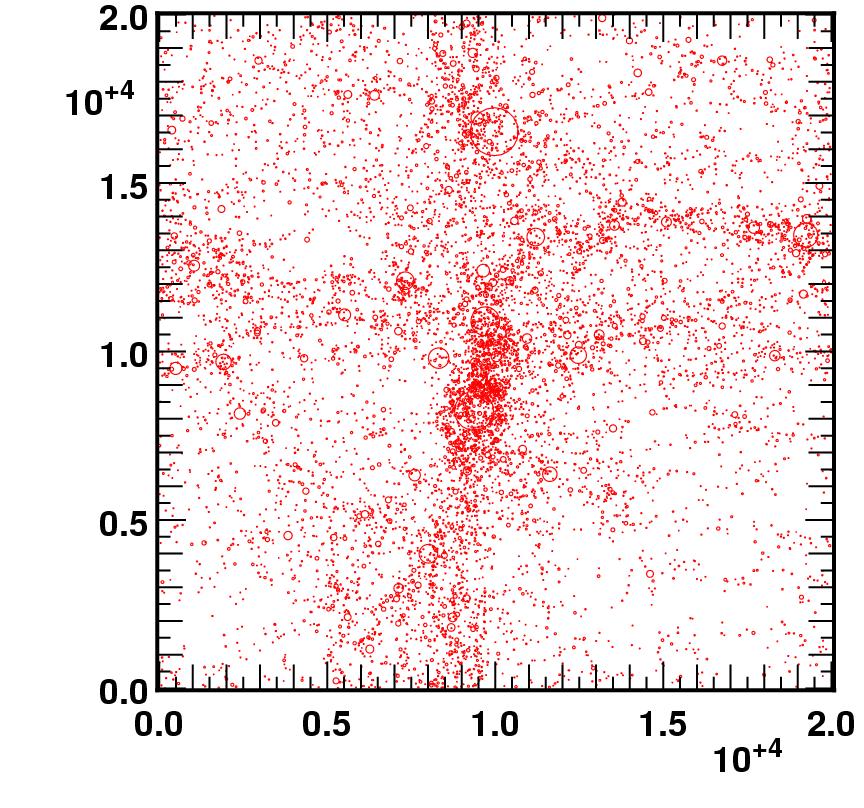
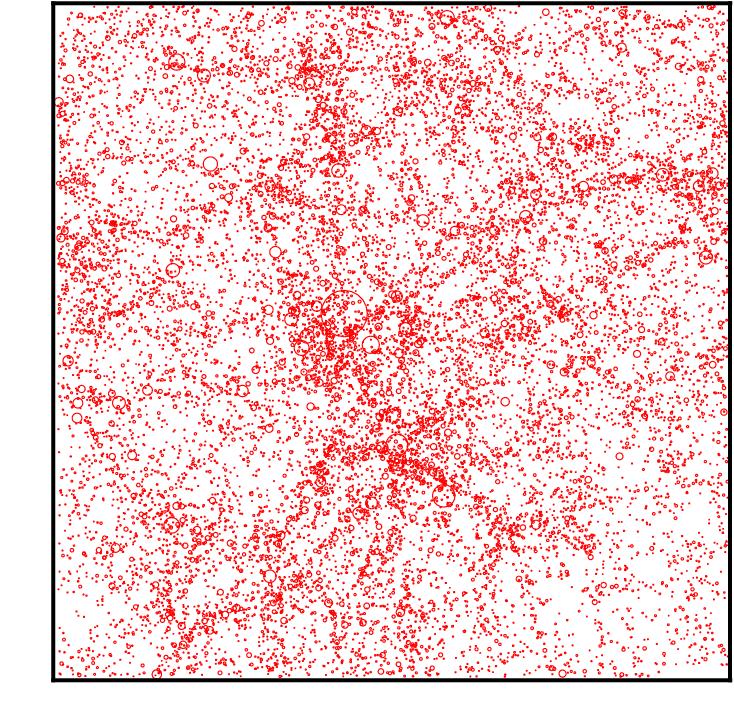
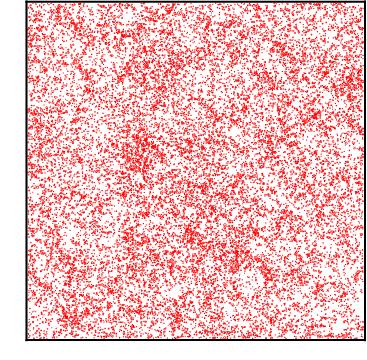
Halos and Substructures location
Power Spectrum at z=0, for the 256^3 simulations (C.Pichon)
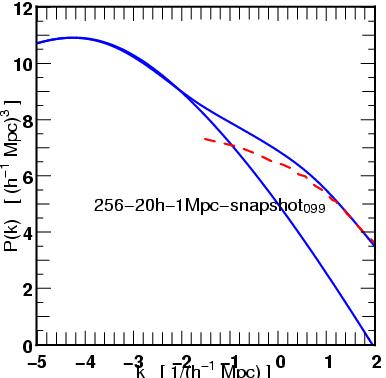 PS z=0 256-20h-1Mpc
| 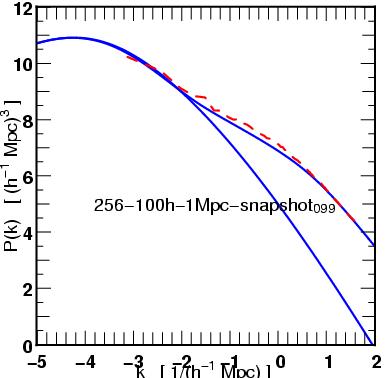 PS z=0 256-100h-1Mpc
| 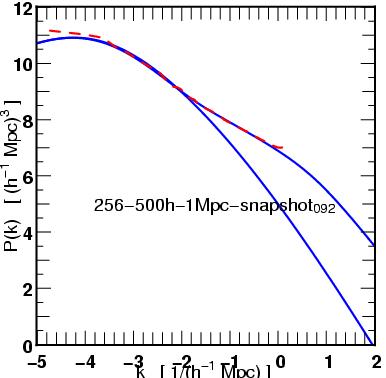 PS z=0 256-500h-1Mpc
|
Power Spectrum at z=0, for the 512^3 simulations (C. Pichon)
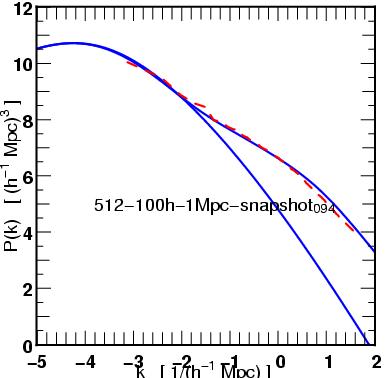 PS z=0 512-100h-1Mpc
| 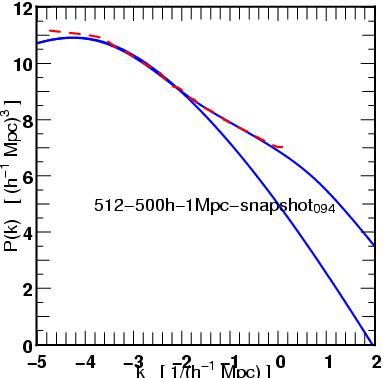 PS z=0 512-500h-1Mpc
|
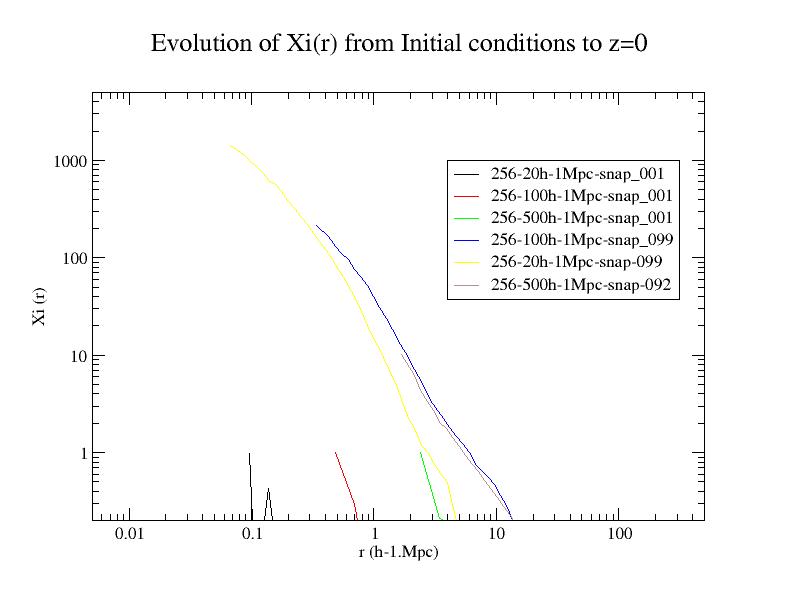
Evolution of the 2-points correlation function from IC to z=0 for the 256^3 simulations (H. Courtois)
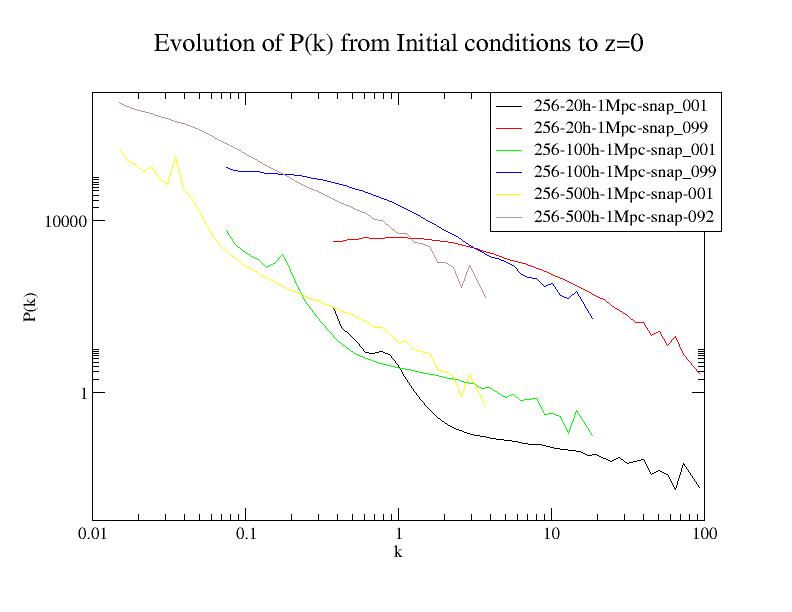
Evolution of P(k) from IC to z=0 for the 256^3 simulations (H. Courtois)
Evolution of P(k) from IC to z=0 for the ![]() and
and ![]() simulations (H. Courtois/S. Courty)
simulations (H. Courtois/S. Courty)
Evolution of the 2-point correlation function from IC to z=0 for the ![]() and
and ![]() simulations (H. Courtois/S. Courty)
simulations (H. Courtois/S. Courty)
Animation: Evolution of the 2-point correlation function from IC to z=0 for the ![]() ,
, ![]() Mpc simulations (H. Courtois/S. Courty)
Mpc simulations (H. Courtois/S. Courty)
Animation: Evolution of the power spectrum from IC to z=0 for the ![]() ,
, ![]() Mpc simulations (H. Courtois/S. Courty)
Mpc simulations (H. Courtois/S. Courty)
