
The site's hierarchy
Navigation
| M | T | W | T | F | S | S |
|---|---|---|---|---|---|---|
| 23 | 24 | 25 | 26 | 27 | 28 | 1 |
| 2 | 3 | 4 | 5 | 6 | 7 | 8 |
| 9 | 10 | 11 | 12 | 13 | 14 | 15 |
| 16 | 17 | 18 | 19 | 20 | 21 | 22 |
| 23 | 24 | 25 | 26 | 27 | 28 | 29 |
| 30 | 31 | 1 | 2 | 3 | 4 | 5 |
- Les premiers zoom de galaxies sont accessibles
- Le halo FOF 6133 de la boite Horizon L et le halo FOF 544 de Horizon S ont été resimulés avec plusieurs techniques de zoom. Il est important que chaque "zoomer" valide sa méthode, avant de lancer une campagne de zoom sur un plus grand cataloque.
- Les données de la simulation Mare Nostrum sont disponibles
- 34 snapshots jusqu’à z=4 sont accessibles sur horizon3 et sur le serveur de fichiers de l’IDRIS à la collaboration Horizon.
- Méso Machine HPC1 opérationnelle
- Depuis le 23 Octobre 2005, la Méso machine du site horizon est operationnelle. Elle correspond à 3 quadriprocesseurs avec chacun 64 Giga de RAM reliés par infiniband, ainsi qu’un access conséquent (sur une base de projet dédié) au reste de la ferme). Son acces est ouvert a toute personne de la collaboration ayant acces à la minigrille et qui en fait la demande a admin-minigrille
- http://
- Workshop Horizon le 14 et 15 novembre 2005
- Il aura lieu à Paris les 14 et 15 novembre 2005 (prévoir une nuit sur place). L’enregistrement est ouvert dans la rubrique "meeting!"
- http://
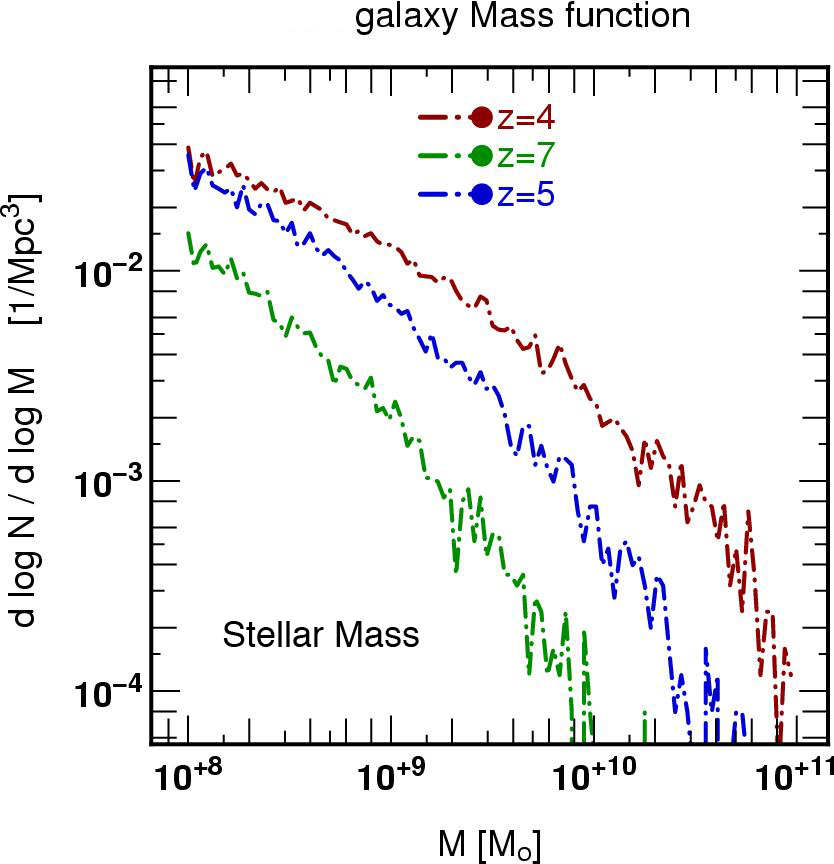
General properties
Description of halo properties
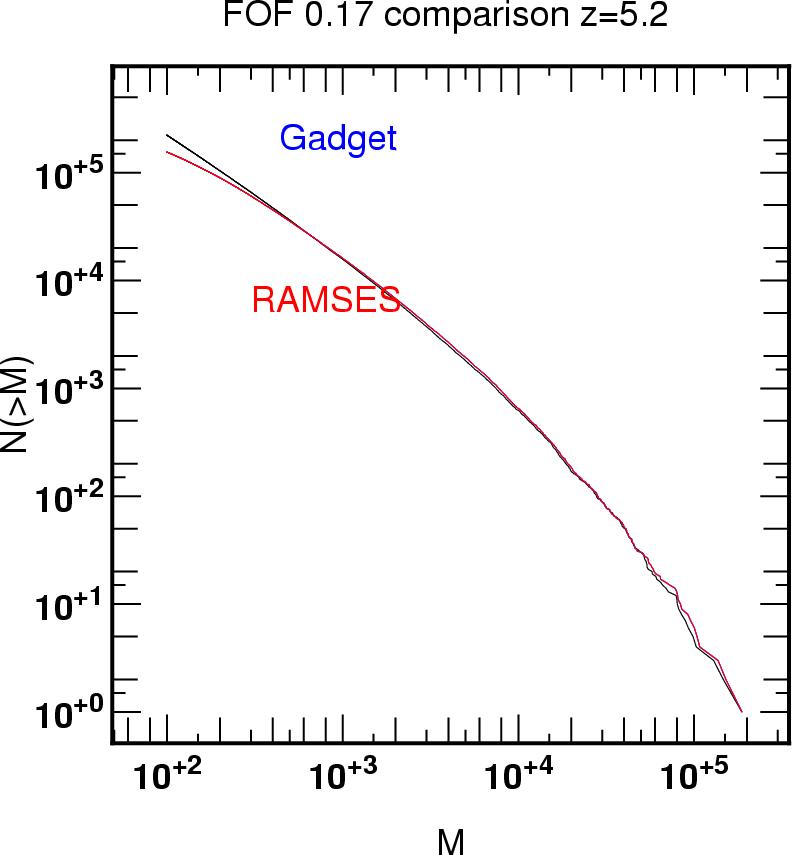
The fof catalogs of MN snapshots are available at /data7/pichon/MN-reduce/*fof.txt
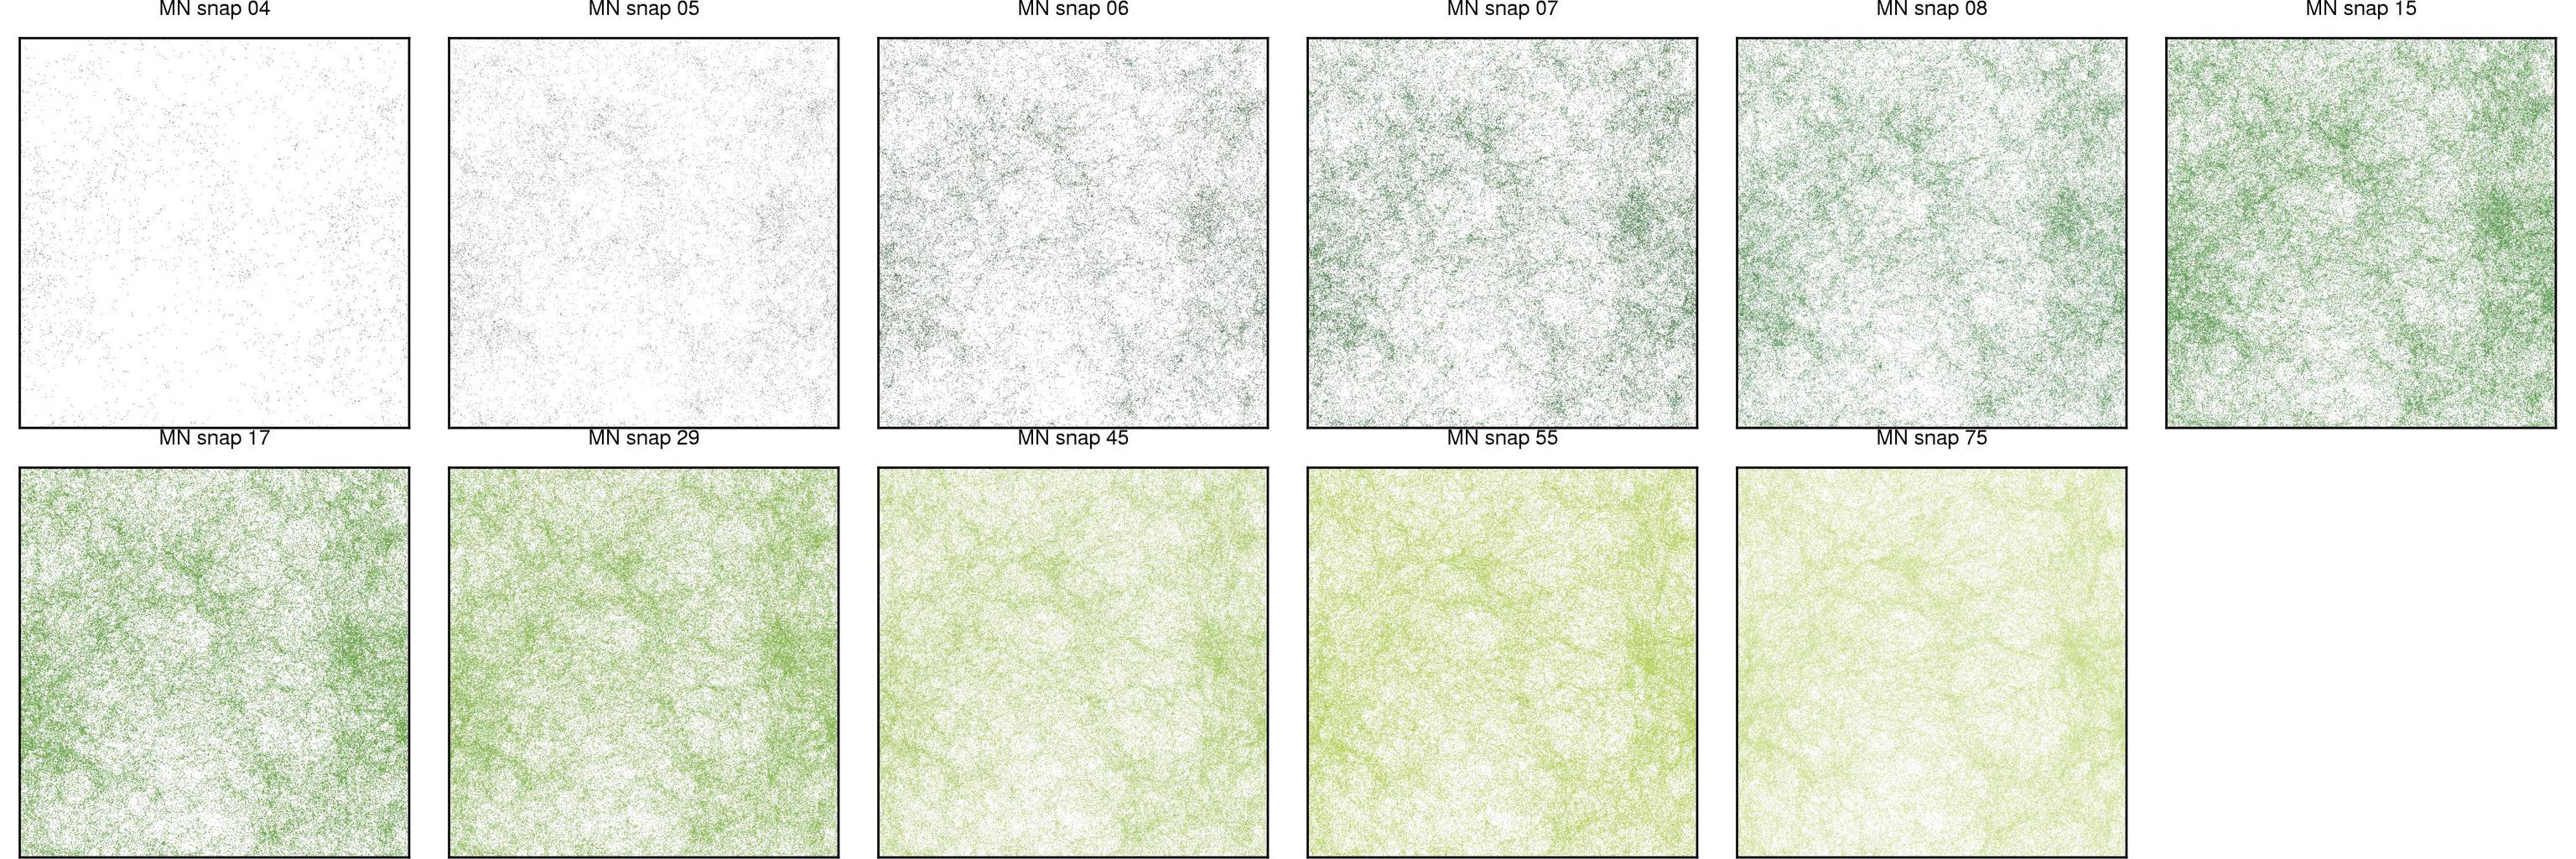
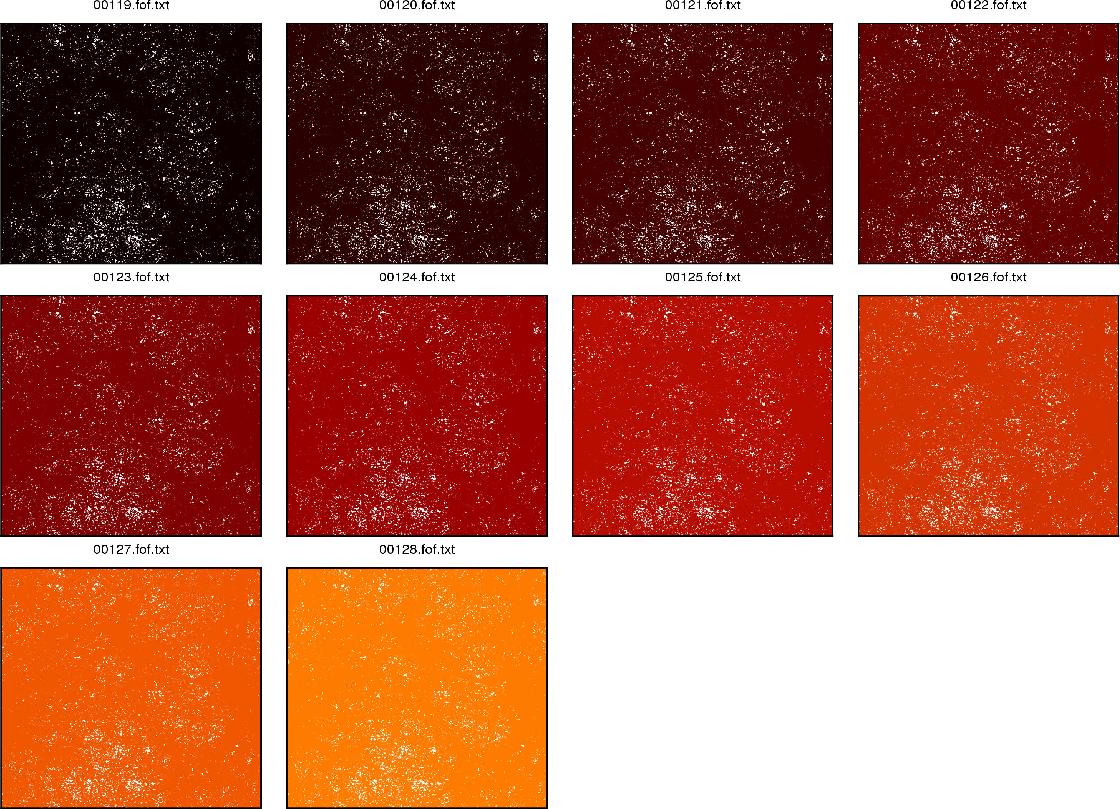
For instance the mass function of the z=5.27 snapshot is :

If you make use of these archives, please let me know
Description of galactic properties
A galaxy is an adaphop substructure (postprocessed by Dylan’s code) which contains at least one star.
If you make use of these archives, please let me know
The galactic properties (each galaxy is a point) are available on the meso machine at /data6/pichon/MN-reduce/output_000??-specGal.pdb for all redshifts down to 2.4. (snapshot 25-75) and can be accessed via, e.g,
~pichon/bin/upload output_00026-specGal.pdb
then the structure,gals contains for instance for the first one
> gals(1)


Gal(leaf=CHalo(level=1,mother=1,firstchild=36693,nsisters=30595,sister=19819,

rho_saddle=81,density=10436,densmax=419636,radius=0.0191201,mass=1.65926e+06,

position=[0.913867,0.723709,0.408795]),pos=[0.913823,0.721701,0.405586],vel=

[-39.9842,-131.369,229.82],mass=3.83566e+10,redshift=4.55822,z_l=-2.75029,z_m=

-2.87464,age_l=93.4809,age_m=279.733,mag_obs=[70.7041,28.188,26.2333,26.3165,

26.3688,26.1744,26.0942,26.76,0,0,0,0,0,0,0,0,0,0,0,0],mag_abs=[-23.6841,

-23.9222,-23.9083,-23.6445,-23.7799,-22.8799,-22.139,-21.2689,0,0,0,0,0,0,0,0,

0,0,0,0],idx=0x84d6c0,spec=0x863960)
you can get a quick glimse a various fields via
> prm,gals(1:5).pos

       0.913823       0.939702      0.0568763       0.538747       0.797268

       0.721701       0.226107       0.602053       0.910152       0.667343

       0.405586       0.143675       0.419281       0.857430       0.798142
and extract into a file of your choice the corresponding fields
> smwrite,"cat.dat",gals(:5).pos

5


> $cat cat.dat

9.138232e-01    9.397020e-01    5.687626e-02    5.387467e-01    7.972681e-01

7.217010e-01    2.261069e-01    6.020526e-01    9.101520e-01    6.673435e-01

4.055863e-01    1.436751e-01    4.192813e-01    8.574300e-01    7.981421e-01
other examples include:
> prm,gals(:5).age_m

        279.733

        270.902

        256.412

        249.187

        233.196

> prm,gals(:5).mag_abs

       -23.6841       -22.6546       -21.5819       -20.8781       -20.3468

       -23.9222       -23.0371       -21.8571       -21.1765       -20.5880

       -23.9083       -23.0181       -21.8084       -21.1286       -20.5591

       -23.6445       -22.8633       -21.6000       -20.9296       -20.3036

       -23.7799       -22.9631       -21.6967       -21.0228       -20.4287

       -22.8799       -22.3004       -20.8552       -20.2002       -19.5206

       -22.1390       -21.5398       -20.0831       -19.4251       -18.7699

       -21.2689       -20.3951       -19.0630       -18.3799       -17.8804
As far as i remember, ages are in Myear, masses in Solar mass, velocities in km/s , metalicities (either mass or luminosity weighted) in mass fraction, magnitudes correspond to the filters "FUV","G","R","I","z","K","IRAC-3.6","IRAC-8.0" as defined by the galics people. The fields, spec and idx are pointers to the spectrum and the particles of the galaxy.
In fact, the archive
>upload spectra-info.pdb

 recovered lw

 recovered metal

 recovered ages

 recovered colname
yields the list of wavelengths, metal ages and color names used to produce the above files.
For instance this can be used to produce a plot of the corresponding spectrum
> plg,*gals(1).spec,lw

> logxy,1,1

> xytitles,"wavelength","flux"
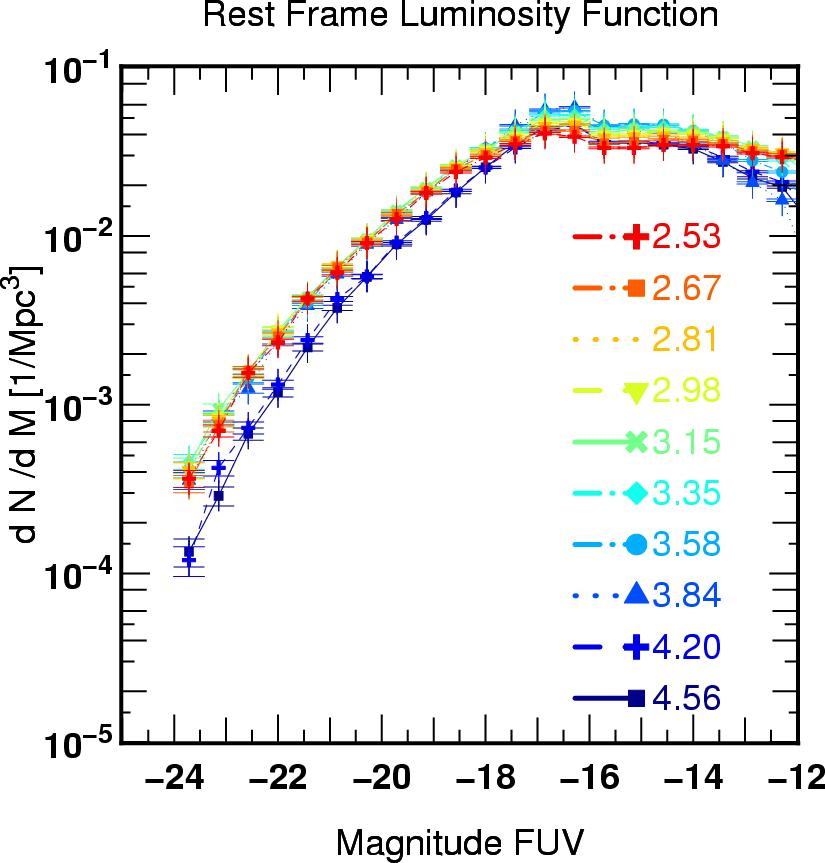
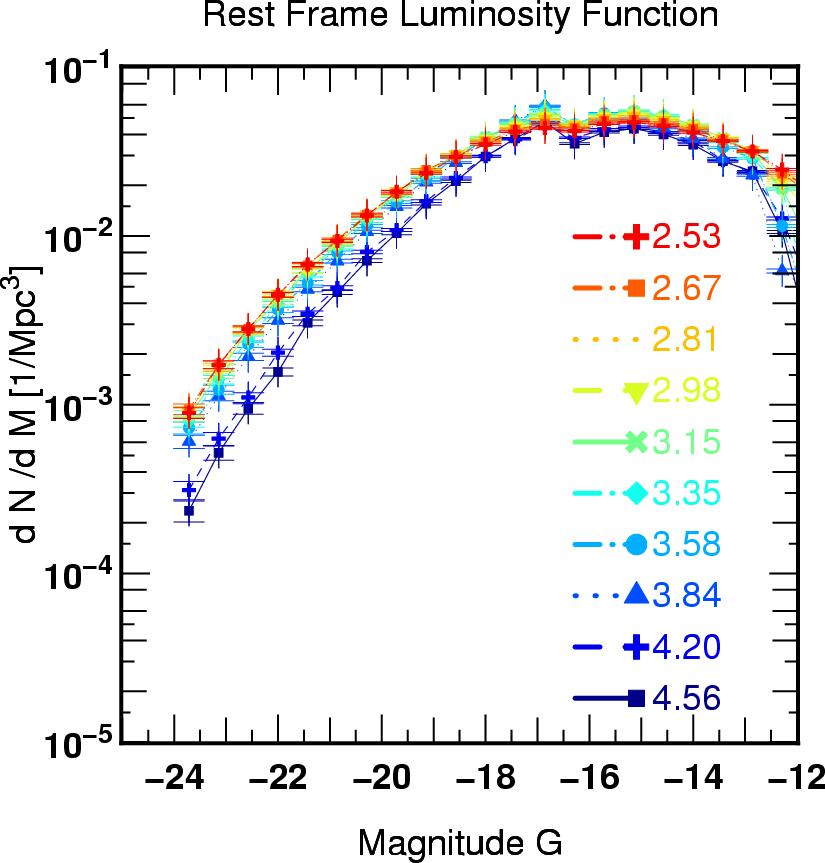
Once the colors are loaded plots such as this one
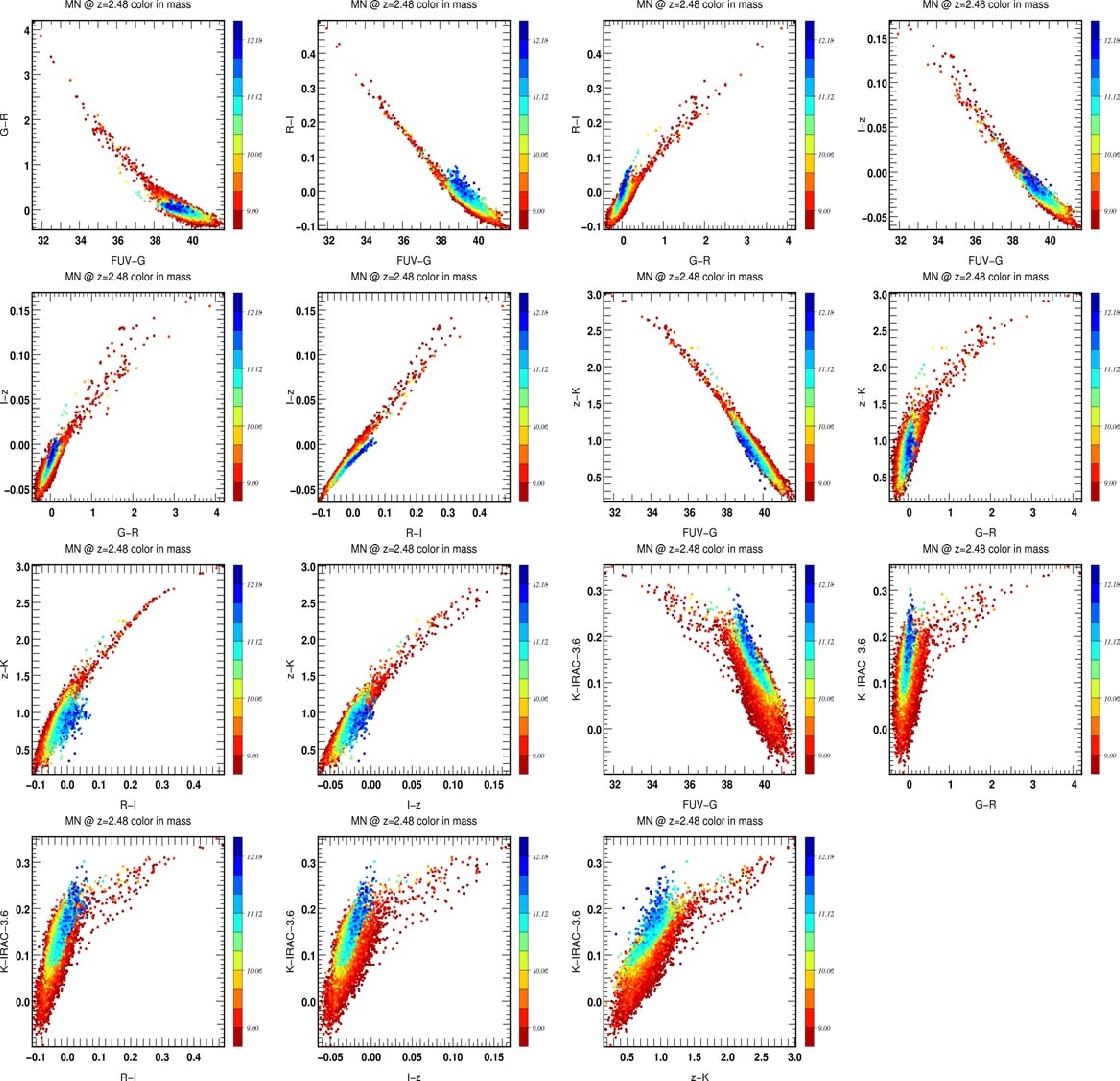 |  |
 |  |
or this one
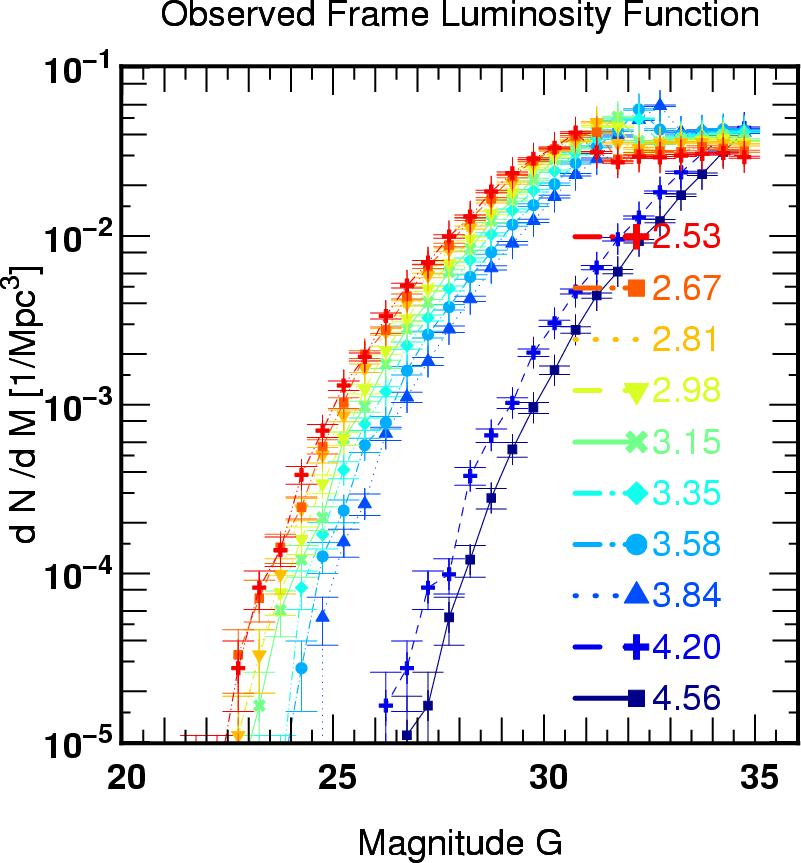 Luminosity function G
| 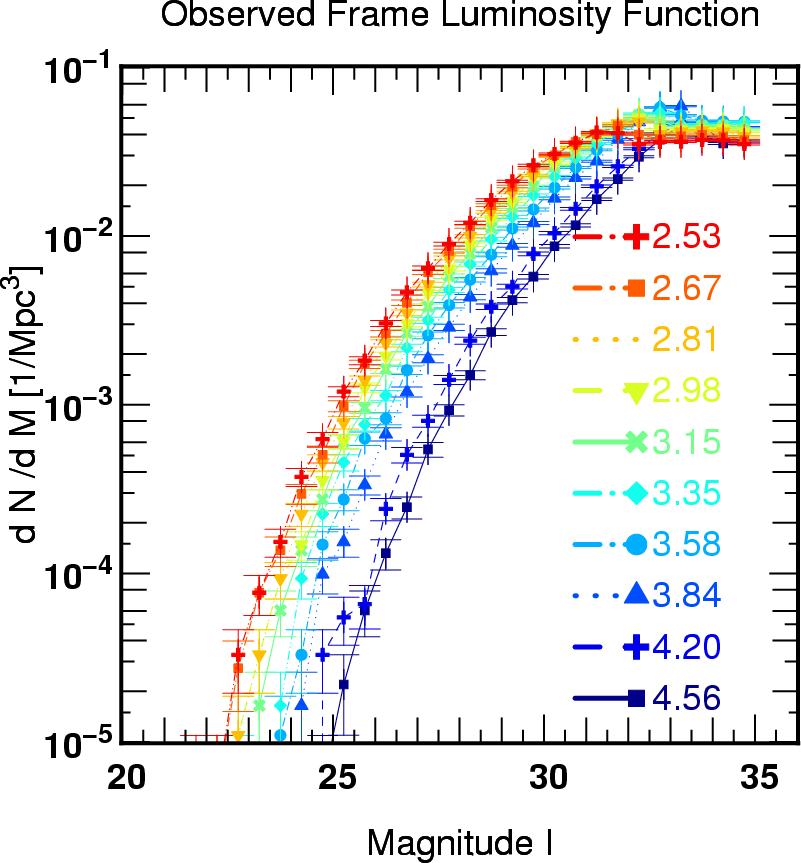 Luminosity function I
| 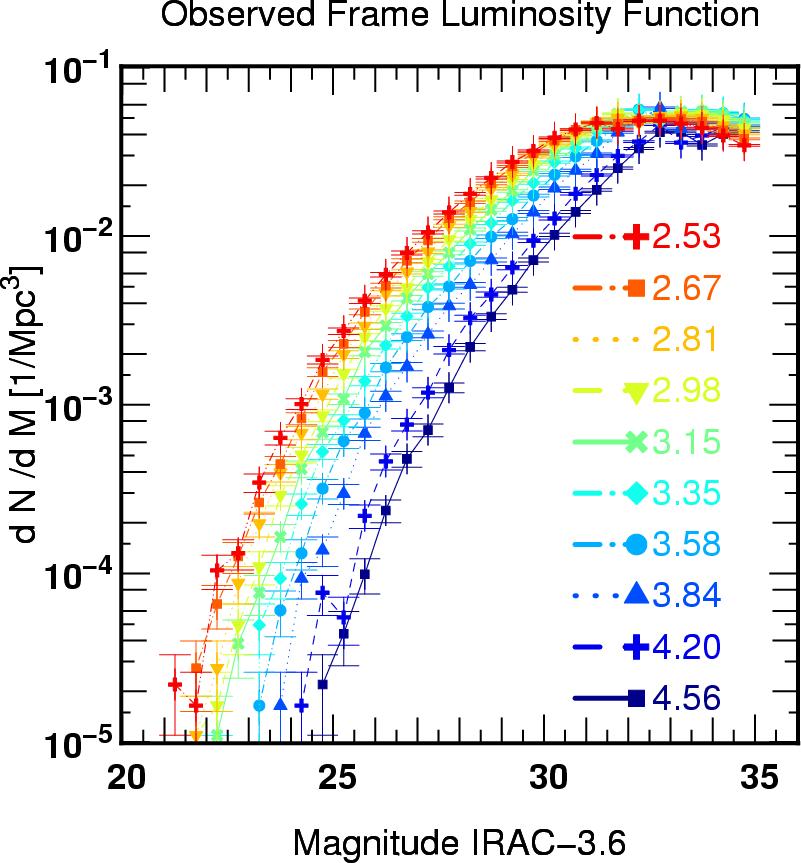 Luninosity function IRAC 3.6
|
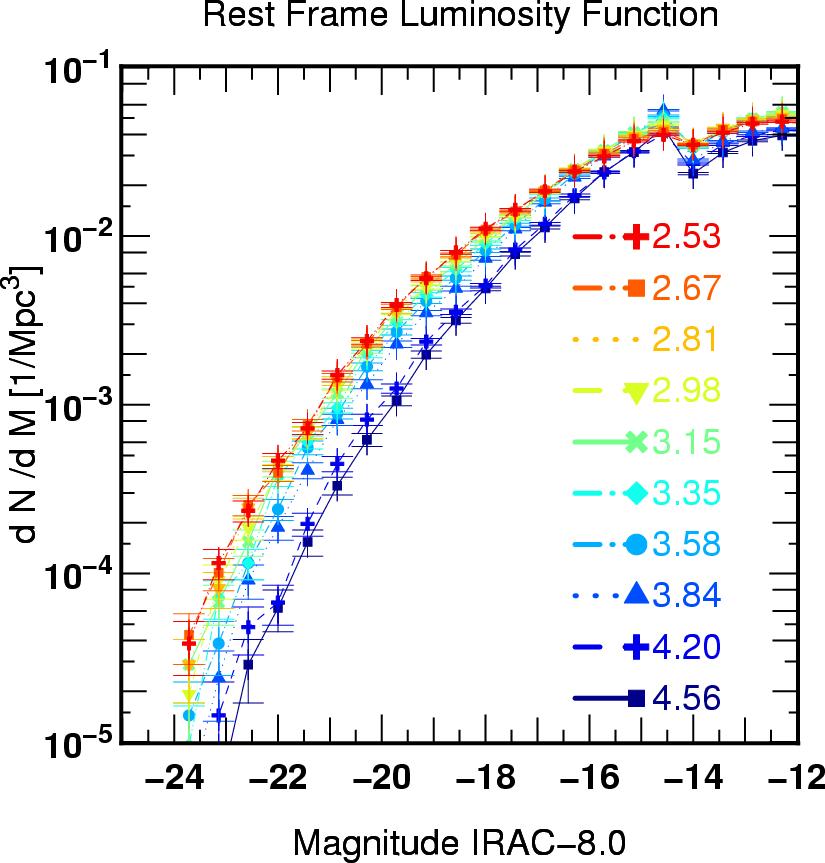
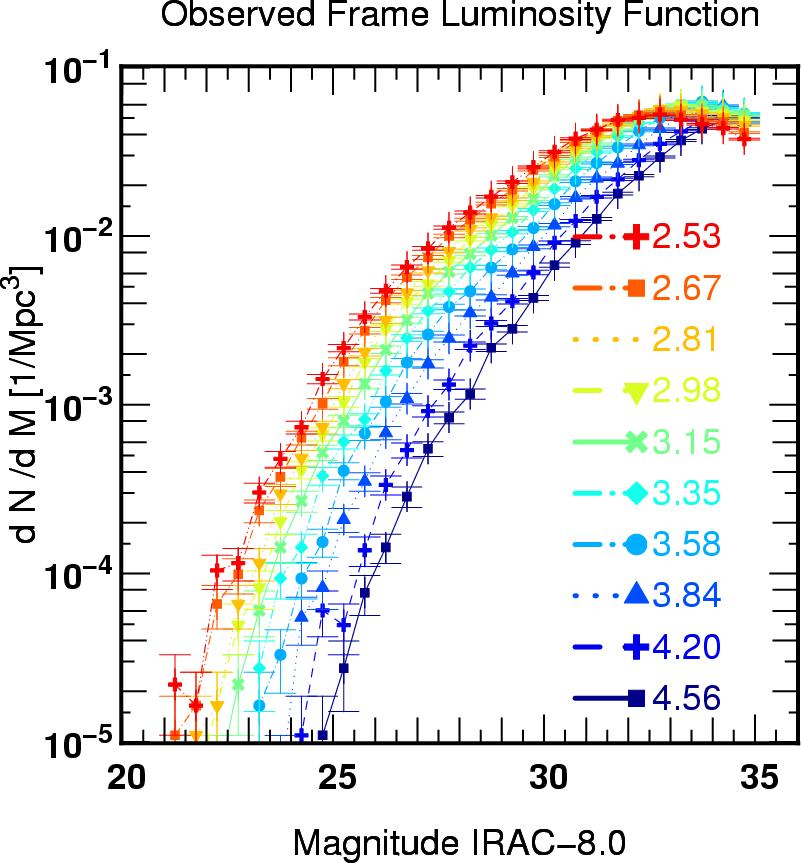 Luninosity function IRAC 8
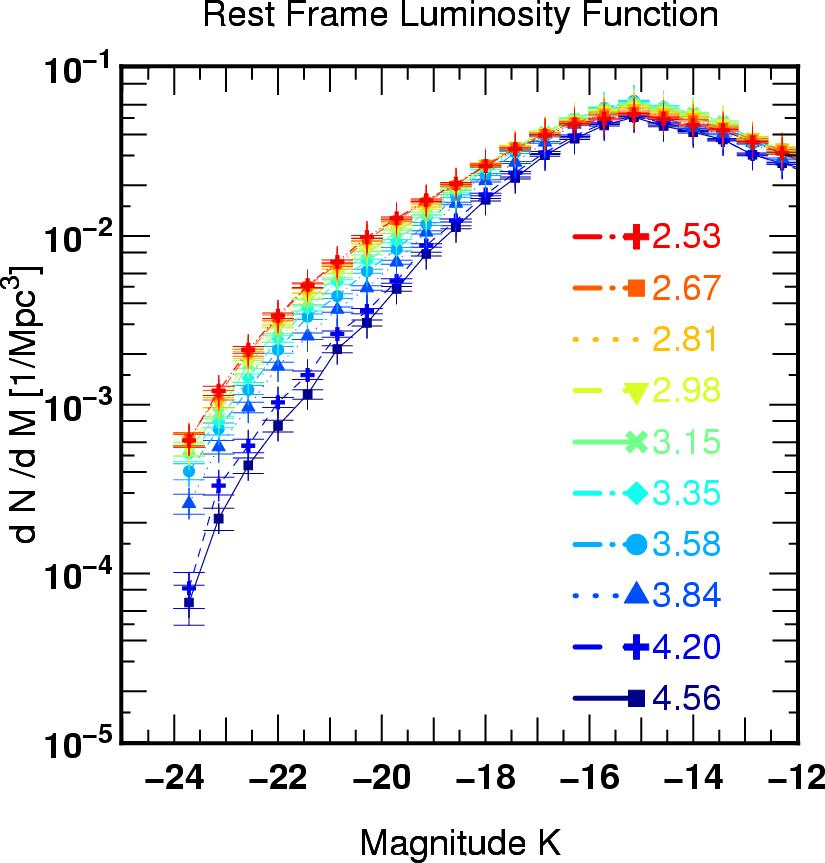
|  Luminosity Function K
| 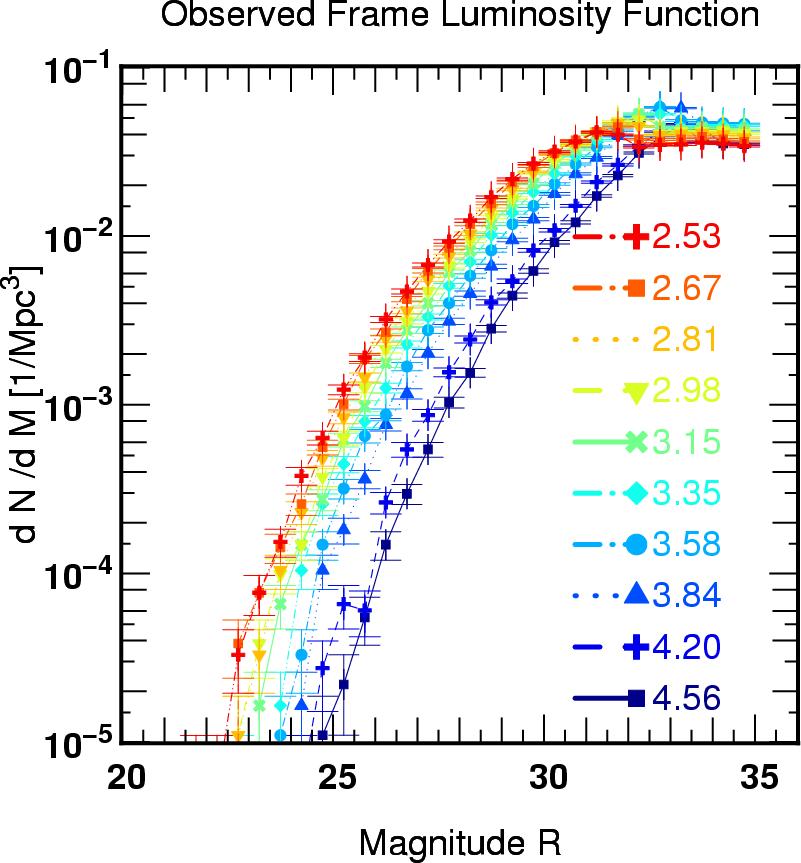 Luminosity Function R
|
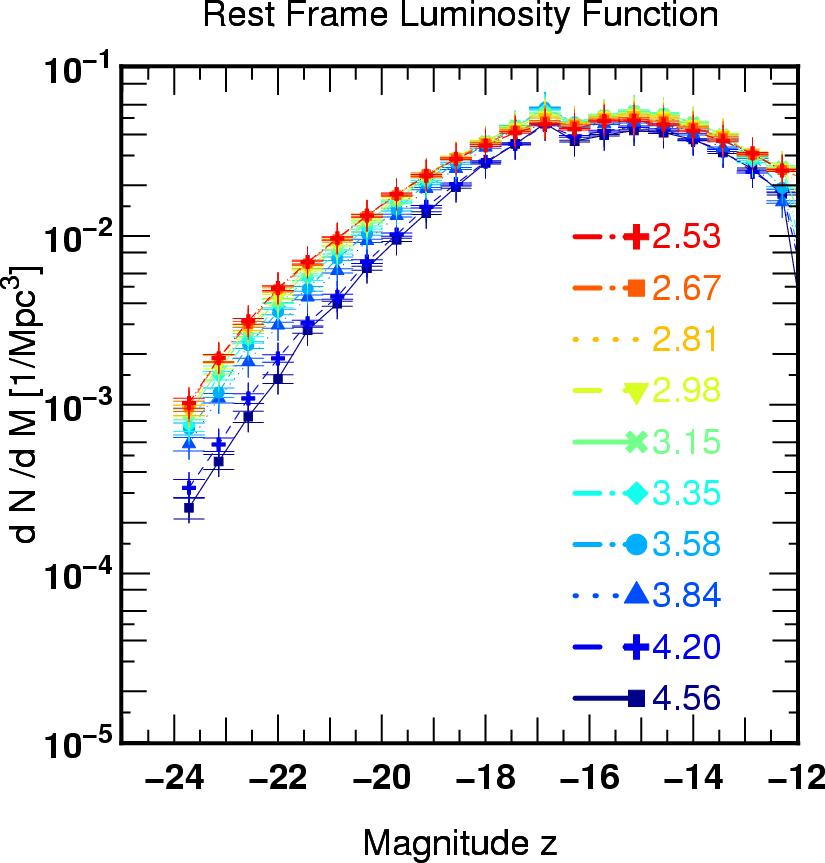
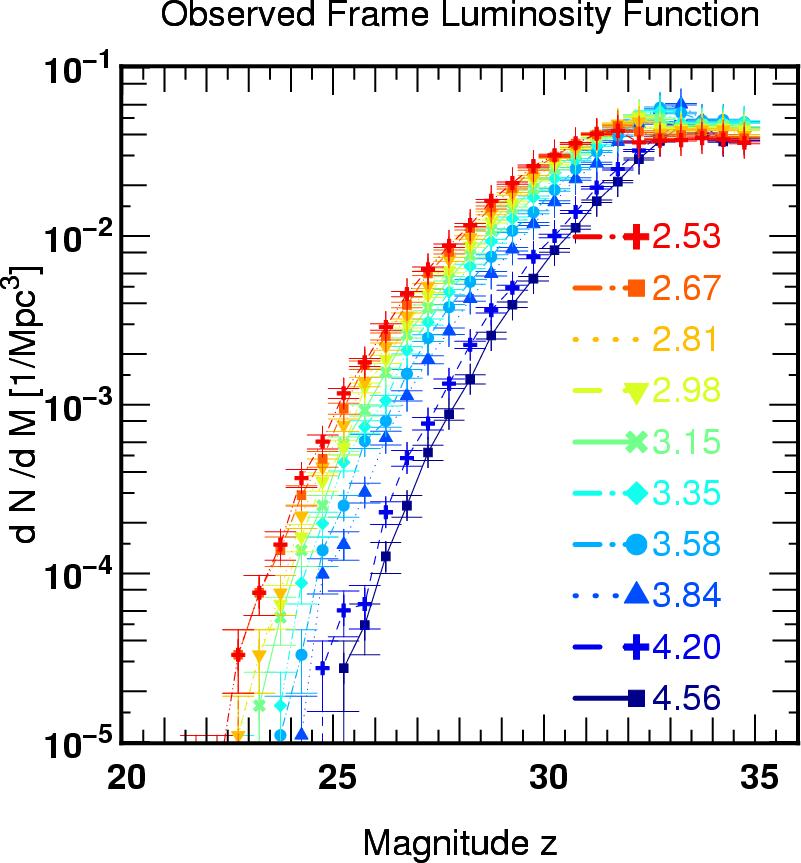 Luminosity Function z
|
are easily produced.
 |  |  |
 |  |  |
 |  |
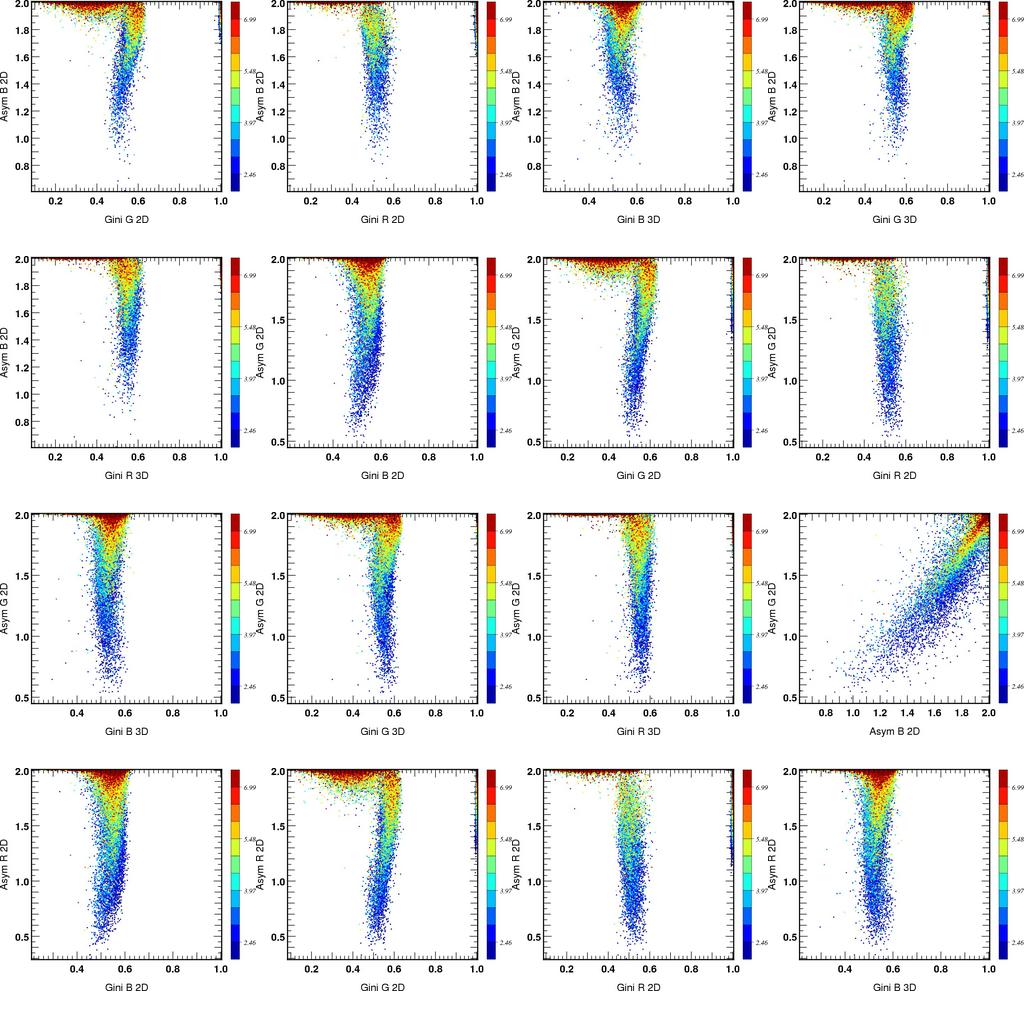
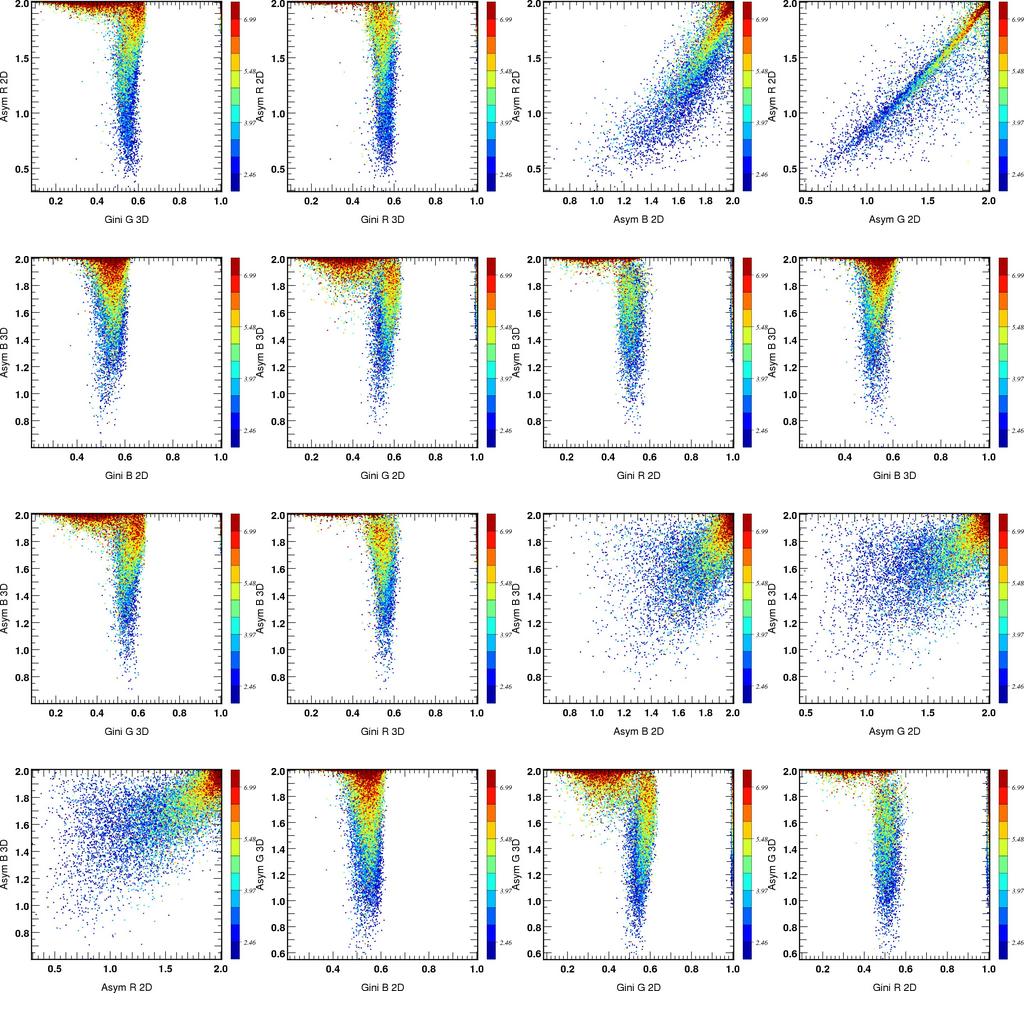
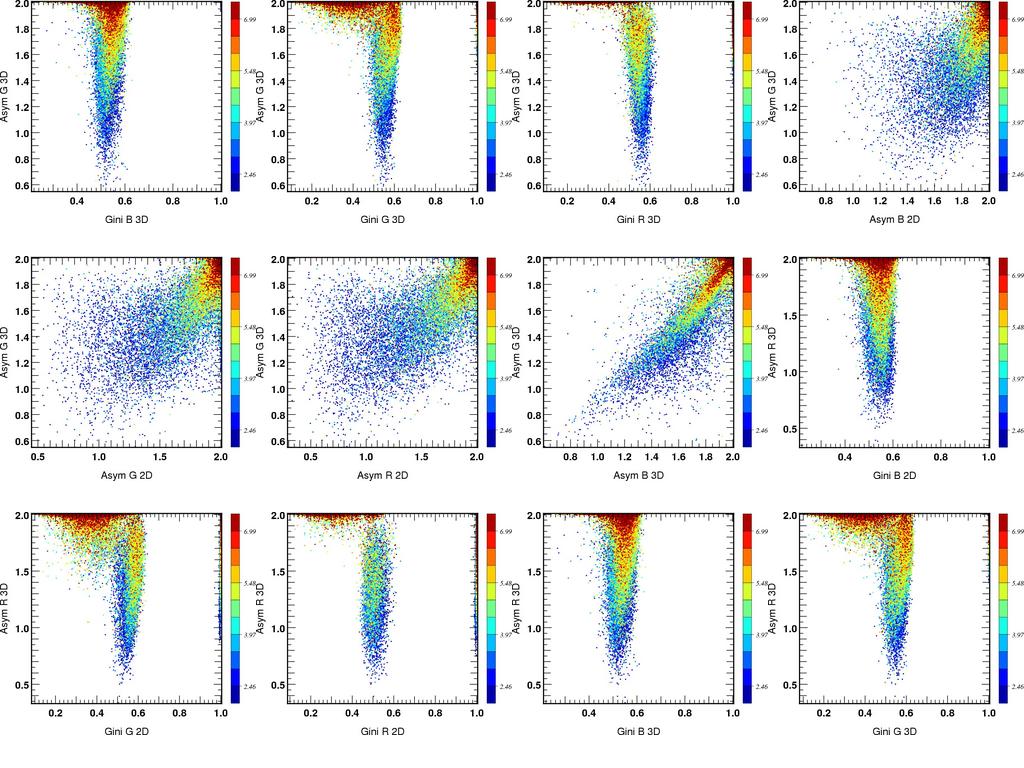
Description of galactic morphology properties
Again If you make use of these archives, please let me know
The galactic morphologic properties (each galaxy is a point) are available on the meso machine at /data7/pichon/MN-reduce/morpho-?.??.pdb for all redshifts down to 2.4. (snapshot 25-75) and can be accessed via, e.g,
~pichon/bin/upload morpho-2.46.pdb
then the structure,gals contains for instance for the first one
> gg(1)

GalMorph(gini=[0.487604,0.497086,0.536725,0.530227,0.540422,0.553448],asym=

[1.10656,0.651927,0.455907,1.27159,1.04628,0.969032],cons=[0.202733,3.28731,

0.944149,1.98984,1.46158,1.09861],ee=[[25.8917,16.351,3.54882],[15.6165,12.672,

3.4732],[8.06235,6.38452,3.10366]],Stype=0,Mtype=0,img=0x983fe0,env=0,redshift=

2.46002)
The gini field correspnods to the Gini number in B G R bands in 2D and 3D (in that order) while the asym and the cons field correspond to the asymmetry and the concentration parameters in B G R bands in 2D and 3D (in that order). The ee field corresponds to the eigen values of the inertia tensor in these 3 filters, while the img field is a pointer to color icon of the galaxy (50x50 pixels).
You can get a quick glimse a various fields via
> w=where(gg.gini(4,)!=0)

> prm,gg(w)(1:5).gini

       0.487604       0.571882       0.477007       0.477736       0.532702

       0.497086       0.570368       0.520107       0.488956       0.535254

       0.536725       0.551619       0.522618       0.507609       0.567791

       0.530227       0.527957       0.534883       0.526452       0.528469

       0.540422       0.538159       0.524045       0.551335       0.553303

       0.553448       0.527303       0.533522       0.548420       0.580504
where the relevant fields (for which the galaxy contained more than 100 SSP in order to compute the morphology with some accuracy.
> smwrite,"cat.dat",gg(w)(1:5).gini

5
Again it is staightforward to produce plots such as
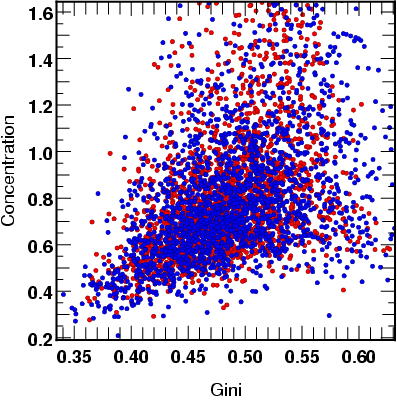 Concentration vz Gini
Red and Blues filters;
The two indicators roughly correlate
| 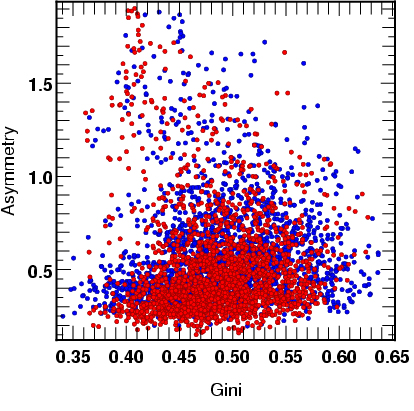 Asymmetry vz Gini
|
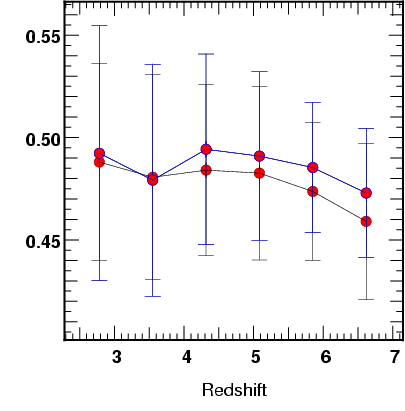 Gini vz Redshift
More "ellipticals" at lower Z
| 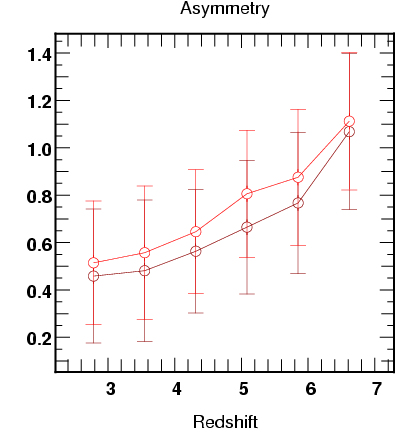 Asymmetry vz redshift
More mergers a larger z
|
or
 Gini Asym Concentration
|  |
 |  |
Redshift to snapshot correspondance
| snapshot number | redshift |
Description of global evolution of simulation
Accretion history
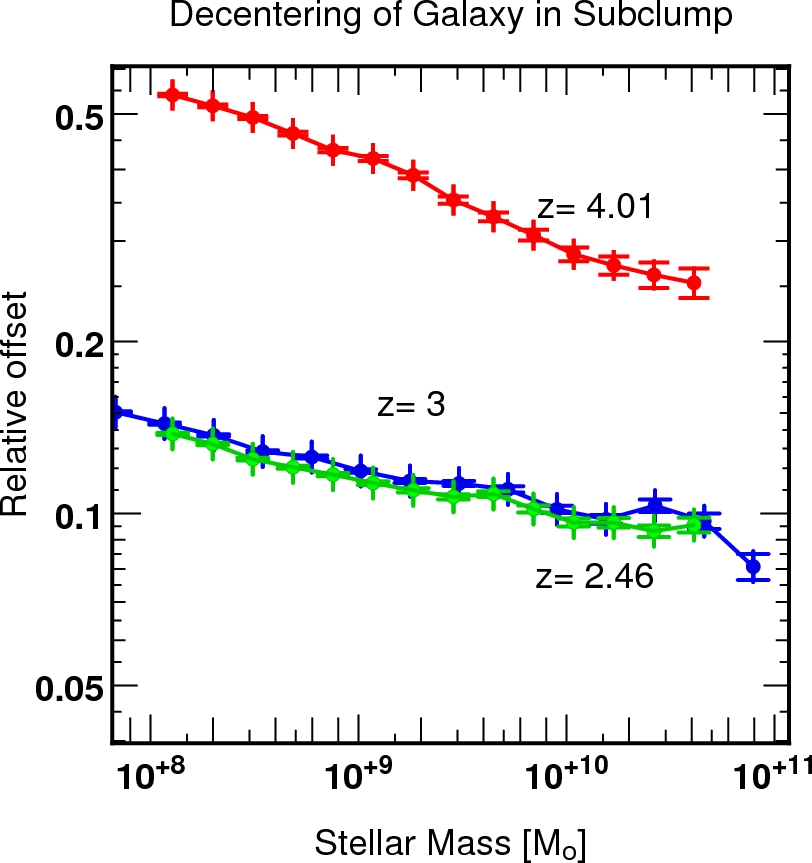 Offcentering of galaxies relative to their DM subclump
measured relative to the center of the adaphop subclump in units of its radius; as exected it decreases with redshift and subclump mass.
|
HOD
Environment of galaxies
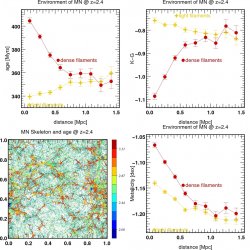 Environments of filaments
Evolution of colour, age, metallicity of galaxies away from core of dense and light filaments (true skeleton)
Environments of filaments
Evolution of colour, age, metallicity of galaxies away from core of dense and light filaments (true skeleton)
Correlation function

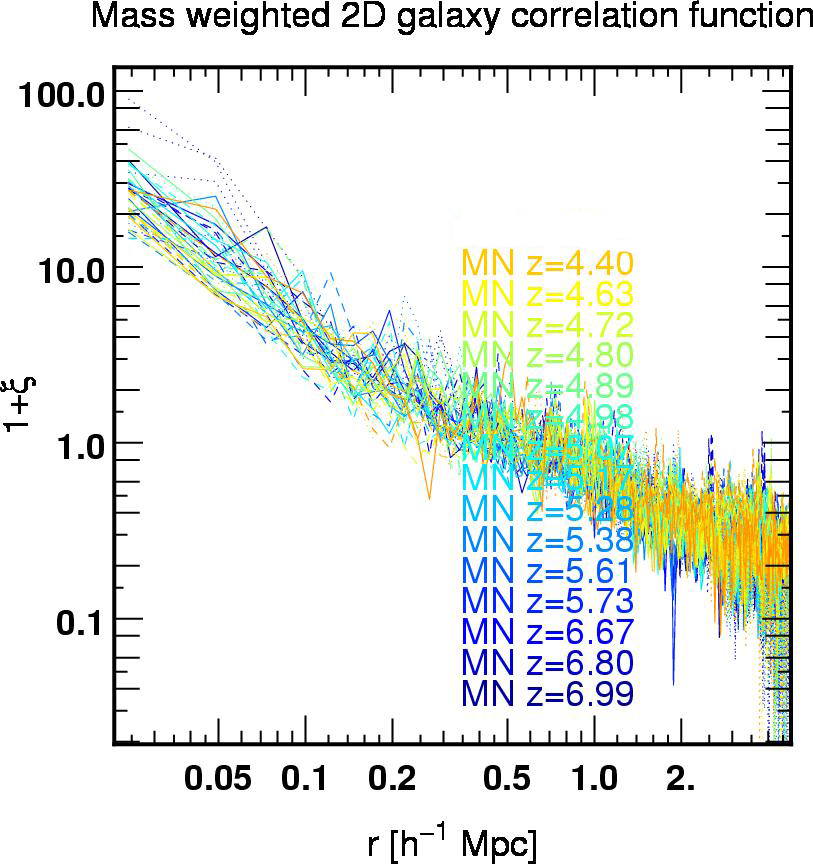 2D correlation function
from galaxies (adaphop+star) in projection along x,y,z directions
| 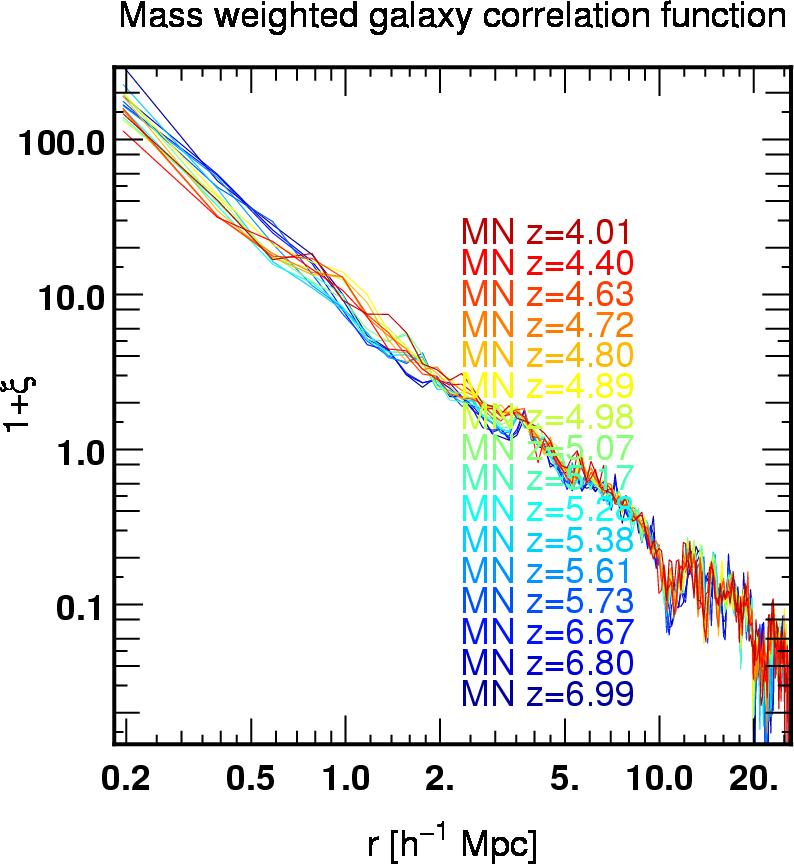 3D correlation function
of galaxies (star+adahop)
|
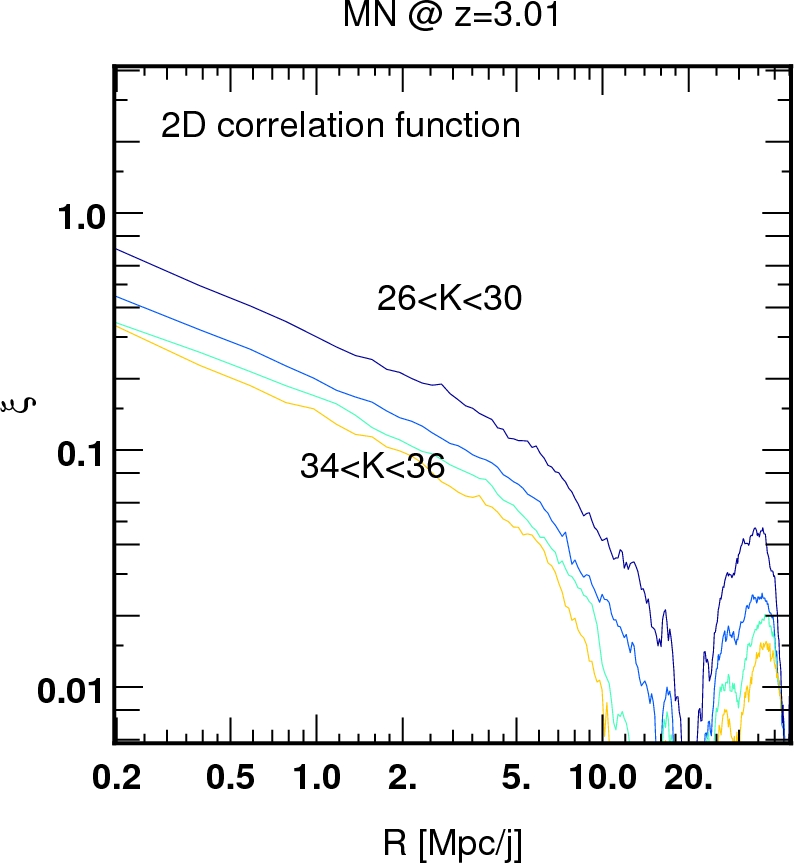 2D correlation function z=3
with cut in apparent K magnitude
|  2D correlation function
With cut in apparent magnitude
|
Skeleton

 |  | 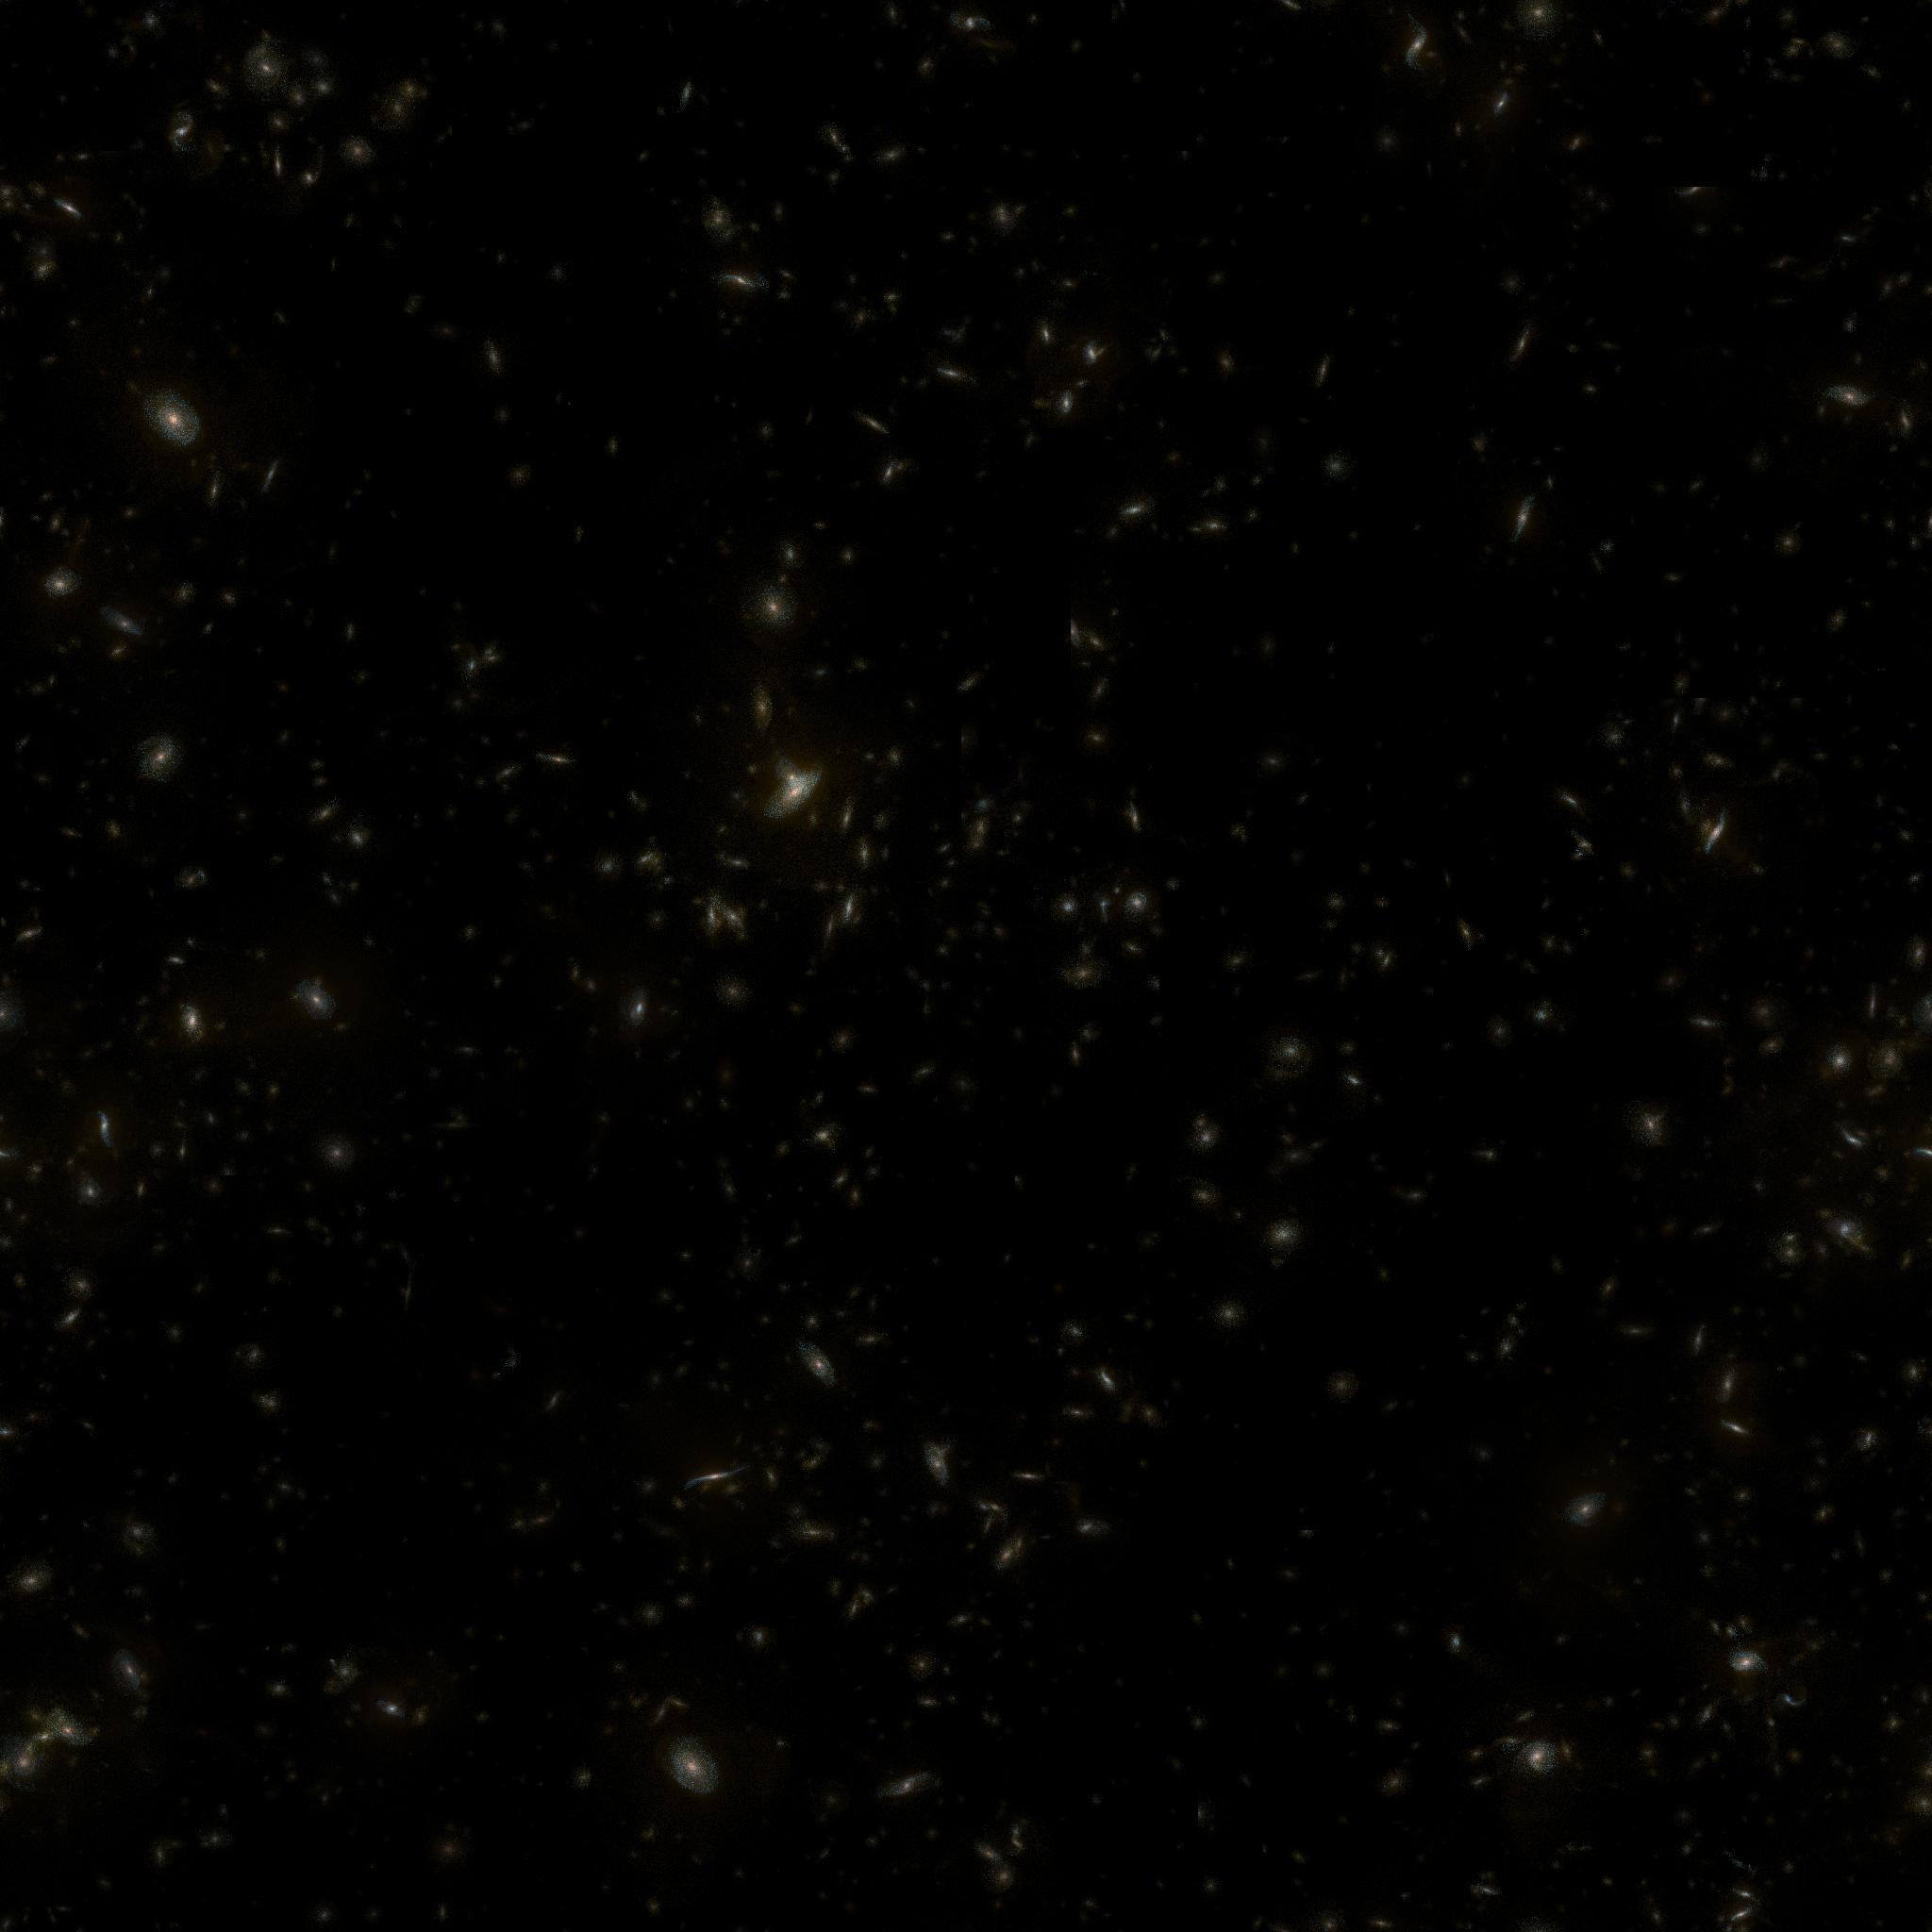 |
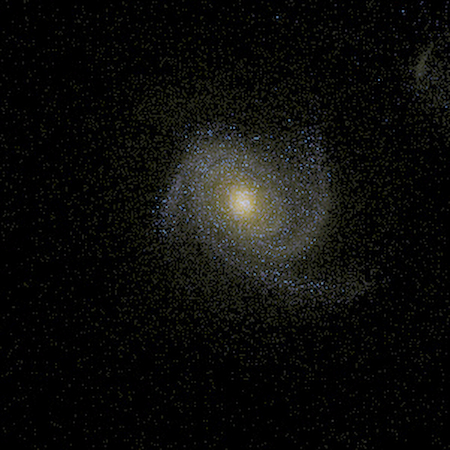
 |  |  composite image of MareNostrum z=1.6
|
composite image of MareNostrum z=1.6
|  |  composite image of MareNostrum z=1.6
|
