
The site's hierarchy
Navigation
| M | T | W | T | F | S | S |
|---|---|---|---|---|---|---|
| 23 | 24 | 25 | 26 | 27 | 28 | 1 |
| 2 | 3 | 4 | 5 | 6 | 7 | 8 |
| 9 | 10 | 11 | 12 | 13 | 14 | 15 |
| 16 | 17 | 18 | 19 | 20 | 21 | 22 |
| 23 | 24 | 25 | 26 | 27 | 28 | 29 |
| 30 | 31 | 1 | 2 | 3 | 4 | 5 |
- Les premiers zoom de galaxies sont accessibles
- Le halo FOF 6133 de la boite Horizon L et le halo FOF 544 de Horizon S ont été resimulés avec plusieurs techniques de zoom. Il est important que chaque "zoomer" valide sa méthode, avant de lancer une campagne de zoom sur un plus grand cataloque.
- Les données de la simulation Mare Nostrum sont disponibles
- 34 snapshots jusqu’à z=4 sont accessibles sur horizon3 et sur le serveur de fichiers de l’IDRIS à la collaboration Horizon.
- Méso Machine HPC1 opérationnelle
- Depuis le 23 Octobre 2005, la Méso machine du site horizon est operationnelle. Elle correspond à 3 quadriprocesseurs avec chacun 64 Giga de RAM reliés par infiniband, ainsi qu’un access conséquent (sur une base de projet dédié) au reste de la ferme). Son acces est ouvert a toute personne de la collaboration ayant acces à la minigrille et qui en fait la demande a admin-minigrille
- http://
- Workshop Horizon le 14 et 15 novembre 2005
- Il aura lieu à Paris les 14 et 15 novembre 2005 (prévoir une nuit sur place). L’enregistrement est ouvert dans la rubrique "meeting!"
- http://
Mass function
Dark energy universe simulations: mass function
I/VALIDATION RUN BABEL
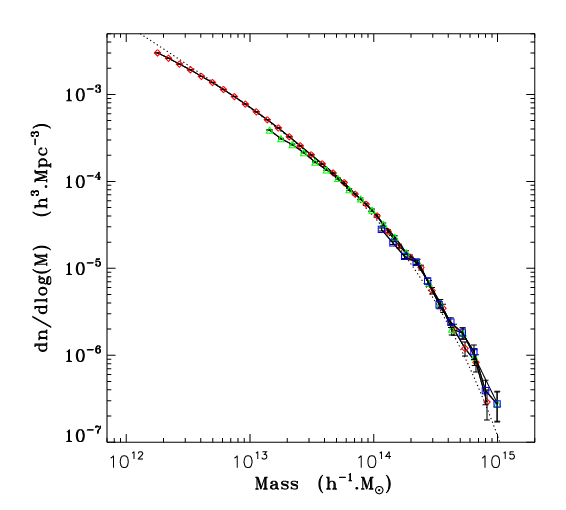
Comparison of the mass function : 512^3 platine (red) vs run 512^3 Babel (green). The model in use is the Ratra-Peebles quinessence cosmologie : RPcdm. The Boxe size is 648h-1.Mpc.

The mass functions from CCRT Platine and IDRIS Babel completely aggree up to the error bars due to two different initial conditions realizations. The doted line represents the Jenkins prediction for the mass function. The agreement with the Jenkins or Sheth&Tormen fits is well established for low mass haloes. We find an agreement for medium range halo masses i.e until 7.10^13 solar mass but a deviation to the Jenkins fit for high mass haloes.
Comparison Jenkins Error Diagram run 512^3 platine (red) vs run 512^3 Babel (green)
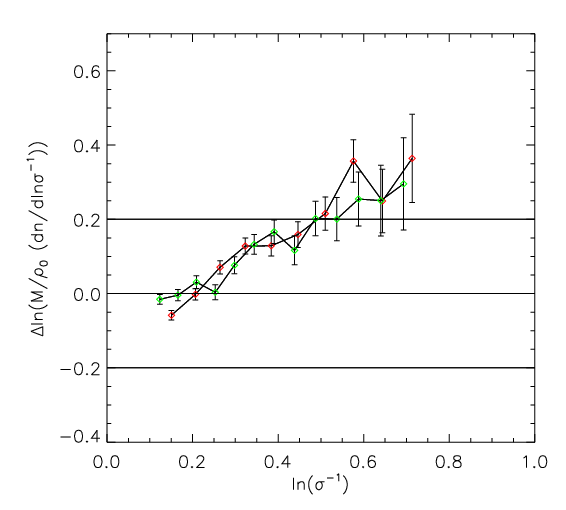
The difference between the Babel and Platine run are caused by the seeds which are different, the ramses versions which are different, and the redshifts which are close to 0 but slightly different!. The two simulations seems therefore compatible. The differences with the Jenkins fit have already been investigated before. First of all, they are very small and they are just amplified by the steep slope of the mass function at the very high mass tail. We found four potential reasons for these differences: hanning filter in the initial conditions of Jenkins and Warren (?), the redshift of intial conditions is too recent (?), bin size effects which were overcorected in jenkins et al 2001(?), N-body solver of Jenkins and Warren which gives lower mass function than the other N-body code (see the Cosmic code comparison project).
II/VALIDATION OF THE PARALLEL FOF
Comparison of the mass functions obtained by the sequential (green) or paralelized (Red) versions of the Friend of Friend algorithm FoF :

The simulation is still RPcdm 512^3 on 648h-1Mpc. The two versions give identical results. This validates the paralelization version (F.Roy).This result is also confirmed by many tests for different numbers of procs for the paralelized version.
III/CONVERGENCE STUDY
We present here the RPcdm simulation on 648h-1.Mpc for three different resolutions. The 1024^3 particules is in red, the 512^3 in green, and the 256^3 in blue :
The mass function are represented over the whole range of mass covered by detected haloes : 100 particules per halo, 40% poissonian noise. The maximum gap between resolutions reaches 20% error for poorly resolved halo masses 100-200 parcticules , as can be seen precisely on the error diagram :
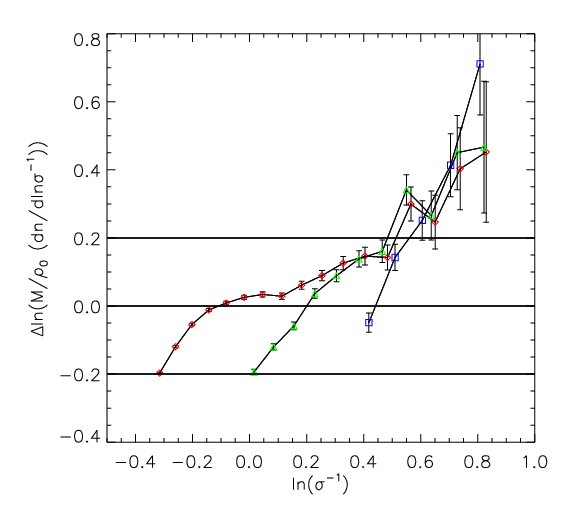
The deviation to the Jenkins fit is confirmed by the numerical convergence.
