The site's hierarchy
Navigation
| M | T | W | T | F | S | S |
|---|---|---|---|---|---|---|
| 23 | 24 | 25 | 26 | 27 | 28 | 1 |
| 2 | 3 | 4 | 5 | 6 | 7 | 8 |
| 9 | 10 | 11 | 12 | 13 | 14 | 15 |
| 16 | 17 | 18 | 19 | 20 | 21 | 22 |
| 23 | 24 | 25 | 26 | 27 | 28 | 29 |
| 30 | 31 | 1 | 2 | 3 | 4 | 5 |
- Les premiers zoom de galaxies sont accessibles
- Le halo FOF 6133 de la boite Horizon L et le halo FOF 544 de Horizon S ont été resimulés avec plusieurs techniques de zoom. Il est important que chaque "zoomer" valide sa méthode, avant de lancer une campagne de zoom sur un plus grand cataloque.
- Les données de la simulation Mare Nostrum sont disponibles
- 34 snapshots jusqu’à z=4 sont accessibles sur horizon3 et sur le serveur de fichiers de l’IDRIS à la collaboration Horizon.
- Méso Machine HPC1 opérationnelle
- Depuis le 23 Octobre 2005, la Méso machine du site horizon est operationnelle. Elle correspond à 3 quadriprocesseurs avec chacun 64 Giga de RAM reliés par infiniband, ainsi qu’un access conséquent (sur une base de projet dédié) au reste de la ferme). Son acces est ouvert a toute personne de la collaboration ayant acces à la minigrille et qui en fait la demande a admin-minigrille
- http://
- Workshop Horizon le 14 et 15 novembre 2005
- Il aura lieu à Paris les 14 et 15 novembre 2005 (prévoir une nuit sur place). L’enregistrement est ouvert dans la rubrique "meeting!"
- http://
Power spectrum
Dark energy universe simulations: power spectrum
I/VALIDATION RUN BABEL
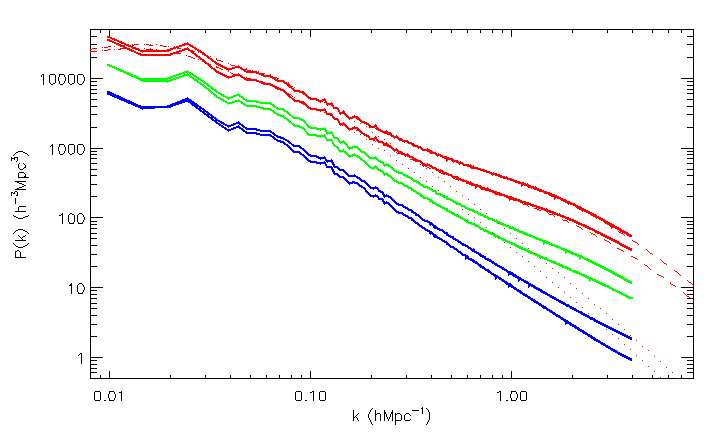
Comparison power spectrum run 512^3 platine (red) vs run 512^3 Babel (green) for RPCDM cosmology. The black curve is the Smith fit whereas the dashed line is the linear power spectrum.

The power spectra seem compatible altogether (seeds are different).
Comparison Smith Error Diagram run 512^3 platine (red) vs run 512^3 Babel (green).

The error diagram show very small differences at the pourcent level between the platine and babel run. The oscillations on the left are some phase effect (because the seeds are different). The sudden raise at high k is due to quick but not very accurate power spectrum computation code. The difference at k of order 1 between the simulations might be due to the different phase, the slight different of redshift (close to 0) and the difference in the RAMSES version. We still didn’t investigate the difference with the Smith fit at intermediate k but we note that the fit was obtain with a different code, and for a different cosmology. Overall this seems to validate the babel 512^3 run.
Redshift evolution of the measured power spectrum normalized by the initial power spectrum (both are linearly extrapolated to z=0). The redshift are astart(black), a=0.3 (red), a=0.5 (green),1.(bleu)
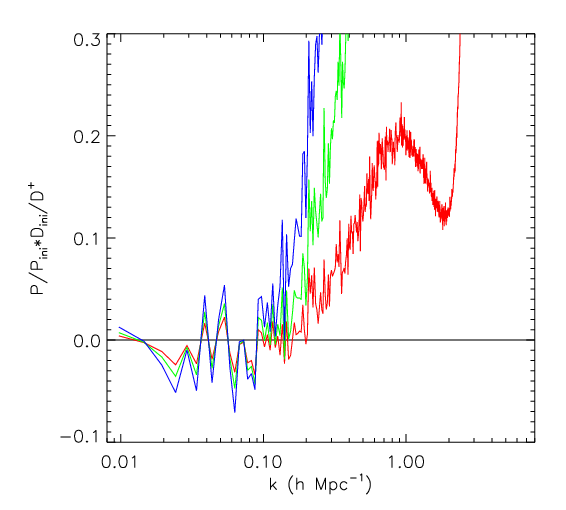
This is a very important test because the superposition of all the P(k) at low k shows that on large scale the spectrum evolves linearly (as expected) with an accuracy of 1 percent. This validates the Poisson Solver on large scale and the quintessence implementation for the cosmology... The origin of deviations may be due to the several approximations in the cosmological code and in the power spectrum computation code. If anybody knows the reason for that, please let me (Yann) know ...
II/VALIDATION PARALLEL POWER SPECTRUM CODE
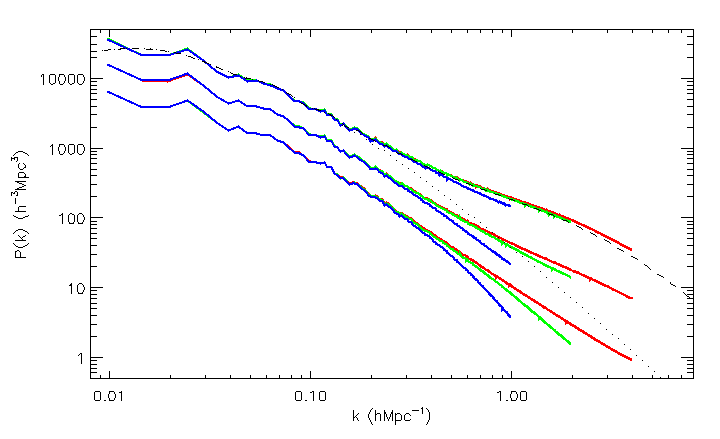
PowergridCIC power spectrum vs powmes (Stephane Colombi) power spectrum

We included a parallel CIC into the powergrid code in order to obtain a quick parallel estimate of the power spectrum. The comparison to powmes is encouraging. On large scale powergrid capture the variations better than powmes because there are more points but as a consequence it is less smooth... On very small scale near the Nyquist frequency of the coarse grid there is a sudden increase because powergrid doesn’t use the resummation technique. In the next graph we will therefore plot until 0.8*f_Nyquist_coarse only... In the intermediate range there is a good agreement between the two code...
III/CONVERGENCE STUDY
IV/COMPARISON LCDM VS RPCDM