The site's hierarchy
- Science
- Conditions Initiales
- Simulations à grandes échelles
- Quintessence et formation des structures
- Horizon Reference simulations
- List of other cosmological simulations
- Marenostrum Simulations
- Horizon 4 π
- Dark energy universe simulations
- Simulations zoom
- Simulations idéalisées
- Observations virtuelles
- Détection des structures
- Outils de mise en ligne
- Outils statistiques
- Methodes inverses
- Outils de Visualisation
- Lecture et formats des données
- Routines et données de physique
- Equations modèles et algorithmes
- Calcul distribué
- Software
- Hardware
- Projet
- Programme
- Liste des tâches
- Conditions Initiales
- Modèles physiques et astrophysiques
- Equations modèles et algorithmes associés
- Modèles semi-analytiques
- Lecture et format des données
- Outils de visualisation
- Outils d’analyse statistique
- Outils de détection des structures
- Génération d’observations virtuelles
- Calcul parallèle et hardware
- Mise en ligne et bases de données
- Management des simulations
- Meetings
- Docs
- Liens
Navigation
Mar 2009
| M | T | W | T | F | S | S |
|---|---|---|---|---|---|---|
| 23 | 24 | 25 | 26 | 27 | 28 | 1 |
| 2 | 3 | 4 | 5 | 6 | 7 | 8 |
| 9 | 10 | 11 | 12 | 13 | 14 | 15 |
| 16 | 17 | 18 | 19 | 20 | 21 | 22 |
| 23 | 24 | 25 | 26 | 27 | 28 | 29 |
| 30 | 31 | 1 | 2 | 3 | 4 | 5 |
News
- Les premiers zoom de galaxies sont accessibles
- Le halo FOF 6133 de la boite Horizon L et le halo FOF 544 de Horizon S ont été resimulés avec plusieurs techniques de zoom. Il est important que chaque "zoomer" valide sa méthode, avant de lancer une campagne de zoom sur un plus grand cataloque.
- Les données de la simulation Mare Nostrum sont disponibles
- 34 snapshots jusqu’à z=4 sont accessibles sur horizon3 et sur le serveur de fichiers de l’IDRIS à la collaboration Horizon.
- Méso Machine HPC1 opérationnelle
- Depuis le 23 Octobre 2005, la Méso machine du site horizon est operationnelle. Elle correspond à 3 quadriprocesseurs avec chacun 64 Giga de RAM reliés par infiniband, ainsi qu’un access conséquent (sur une base de projet dédié) au reste de la ferme). Son acces est ouvert a toute personne de la collaboration ayant acces à la minigrille et qui en fait la demande a admin-minigrille
- http://
- Workshop Horizon le 14 et 15 novembre 2005
- Il aura lieu à Paris les 14 et 15 novembre 2005 (prévoir une nuit sur place). L’enregistrement est ouvert dans la rubrique "meeting!"
- http://
Initial conditions
by Rasera Yann
(Monday 27 October 2008)
Dark energy universe simulations: initial conditions
I/VALIDATION RUN BABEL
We generate 2048^3 initial conditions with the MPGRAFIC package (Prunet et al., 2008) on 256 cores of Babel. We then degraded the conditions from 2048^3 to 256^3 with the Degraf code and computed the power spectum with Powergrid.
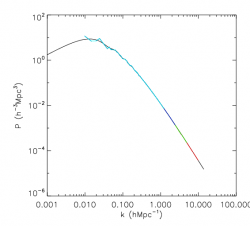
Here is the power spectrum for the different resolutions compared to the linear power spectrum.
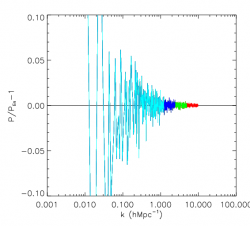
And the assiocated error diagram.
The agreement with the linear spectrum is good.
Special thanks to Simon for his great help...


