The site's hierarchy
Navigation
| M | T | W | T | F | S | S |
|---|---|---|---|---|---|---|
| 23 | 24 | 25 | 26 | 27 | 28 | 1 |
| 2 | 3 | 4 | 5 | 6 | 7 | 8 |
| 9 | 10 | 11 | 12 | 13 | 14 | 15 |
| 16 | 17 | 18 | 19 | 20 | 21 | 22 |
| 23 | 24 | 25 | 26 | 27 | 28 | 29 |
| 30 | 31 | 1 | 2 | 3 | 4 | 5 |
- Les premiers zoom de galaxies sont accessibles
- Le halo FOF 6133 de la boite Horizon L et le halo FOF 544 de Horizon S ont été resimulés avec plusieurs techniques de zoom. Il est important que chaque "zoomer" valide sa méthode, avant de lancer une campagne de zoom sur un plus grand cataloque.
- Les données de la simulation Mare Nostrum sont disponibles
- 34 snapshots jusqu’à z=4 sont accessibles sur horizon3 et sur le serveur de fichiers de l’IDRIS à la collaboration Horizon.
- Méso Machine HPC1 opérationnelle
- Depuis le 23 Octobre 2005, la Méso machine du site horizon est operationnelle. Elle correspond à 3 quadriprocesseurs avec chacun 64 Giga de RAM reliés par infiniband, ainsi qu’un access conséquent (sur une base de projet dédié) au reste de la ferme). Son acces est ouvert a toute personne de la collaboration ayant acces à la minigrille et qui en fait la demande a admin-minigrille
- http://
- Workshop Horizon le 14 et 15 novembre 2005
- Il aura lieu à Paris les 14 et 15 novembre 2005 (prévoir une nuit sur place). L’enregistrement est ouvert dans la rubrique "meeting!"
- http://
Yorick to VOTable data translation
Yorick to VOTable data translation
Jean Pichon 2007
A tool to generate VOTables from yorick structures used in Horizon.
Purpose
The reduction of simulations in Horizon is often carried within yorick or Idl. In order to distribute the final tables within the Theoretical Virtual Observatory, we have produced a code which converts automatically any yorick structure into a VO table.
Method
Having defined the structures [1]
struct Leaf {

  int level;

  int mother;

}


struct Gal {

  int pos(3);

  Leaf leaf;

}
then, with
>g = Gal();
>d=VOExtractDescription(g);
returns
"pos = {datatype = <float>, arraysize = <*>}, leaf = (level = {datatype = <int>}, mother = {datatype = <int>})"
which can be used as an input [2] for "toVOTable":
>toVOTable, ["name = <particles>, datatype = <int>, value = <3>"], d, [g];
which yields
For more information, read "votable.i" (esp. with "help, toVOTable" and "help, VOExtractDescription") and the VOTable standard
Horizon Example
A more evolved example involves converting the first few objects of a structure such as those found in the spectral data structure:
For instance
~pichon/bin/upload output_00040-specGal.pdb
then the structure, gals contains for its first element
> gals(1)

Gal(leaf=CHalo(level=1,mother=1,firstchild=36693,nsisters=30595,sister=19819,

rho_saddle=81,density=10436,densmax=419636,radius=0.0191201,mass=1.65926e+06,

position=[0.913867,0.723709,0.408795]),pos=[0.913823,0.721701,0.405586],vel=

[-39.9842,-131.369,229.82],mass=3.83566e+10,redshift=4.55822,z_l=-2.75029,z_m=

-2.87464,age_l=93.4809,age_m=279.733,mag_obs=[70.7041,28.188,26.2333,26.3165,

26.3688,26.1744,26.0942,26.76,0,0,0,0,0,0,0,0,0,0,0,0],mag_abs=[-23.6841,

-23.9222,-23.9083,-23.6445,-23.7799,-22.8799,-22.139,-21.2689,0,0,0,0,0,0,0,0,

0,0,0,0],idx=0x84d6c0,spec=0x863960)
Following the same steps as before yields:
See this document
for a larger sample of the structure in VOTable format.
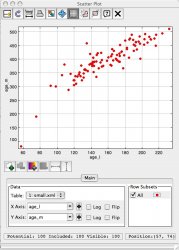
Once the xml code has been generated, the fun is endless as illustrated on this example using TOPCAT. Here we scatter plot the first two fields:

WARNING: The data must be "VOTable-able", i.e. have a structure obviously mappable to the VOTable format as described here. This function implements VOTable version 1.1.
Possible extensions
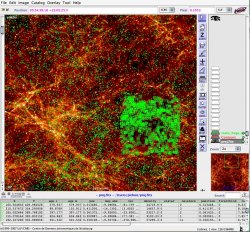
![]() make the pointers open another page with possibly topcat or aladin ?
make the pointers open another page with possibly topcat or aladin ?
Special thanks to J. Pichon F. Bonnarel and M. Louys.


